# Packages
import numpy as np
import matplotlib.pyplot as plt
from matplotlib import cm
# Use LaTeX font
plt.rcParams.update({'text.usetex': True})
# Figure font config
label_font = {'fontfamily': 'Arial Black', 'fontsize': 14}
title_font = {'fontfamily': 'Arial Black', 'fontsize': 14}
# Generate data
X = np.linspace(0, 1, num=256, endpoint=True)
Y = np.linspace(0, 1, num=256, endpoint=True)
X, Y = np.meshgrid(X, Y)
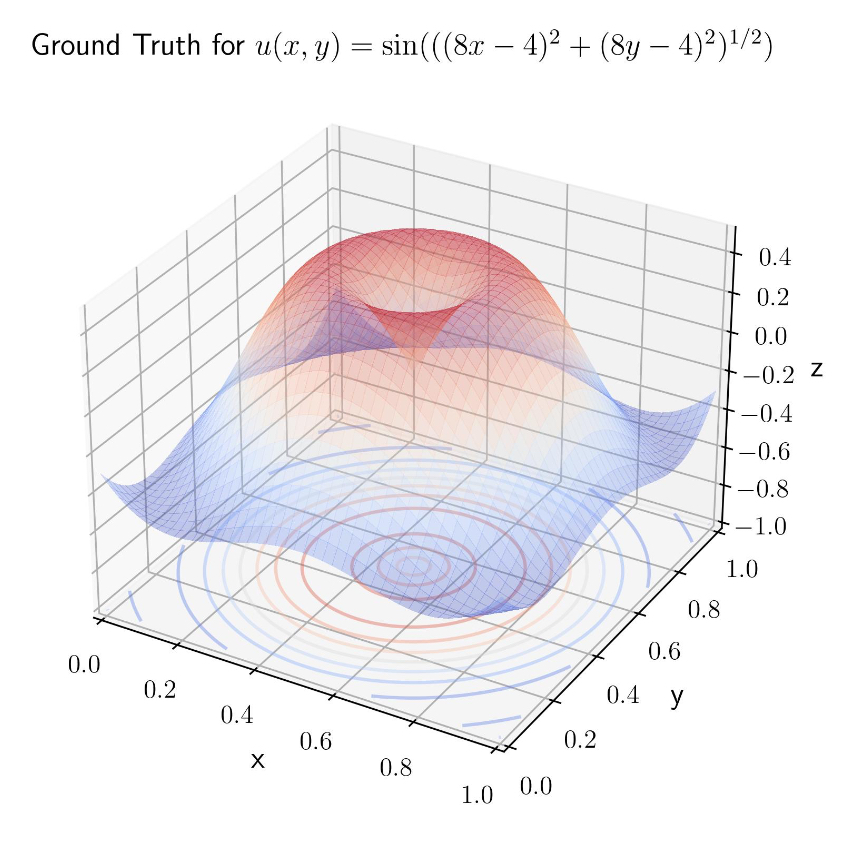
R = np.sqrt(1 * ((8 * X-4)**2 + (8 * Y - 4)**2))
Z = 0.5 * np.sin(R)
# Plot
ax = plt.figure(figsize=(8, 6)).add_subplot(projection='3d')
surf = ax.plot_surface(
X, Y, Z,
cmap=cm.coolwarm,
linewidth=1,
antialiased=False,
alpha=0.3
)
contour = ax.contour(
X, Y, Z,
zdir='z',
levels=8,
offset=-1,
cmap=cm.coolwarm,
alpha=0.4
)
ax.set_xlim(0, 1)
ax.set_ylim(0, 1)
ax.set_zlim(-1, 0.5)
ax.set_xlabel('x', fontdict=label_font)
ax.set_ylabel('y', fontdict=label_font)
ax.set_zlabel('z', fontdict=label_font)
ax.set_title(
r'Ground Truth for $u(x, y) = \mathrm{sin}(((8x-4)^2+(8y-4)^2)^{1/2})$',
fontdict=title_font
)
ax.tick_params(axis='both', which='major', labelsize=12)
ax.tick_params(axis='both', which='minor', labelsize=12)
labels = ax.get_xticklabels() + ax.get_yticklabels() + ax.get_zticklabels()
[label.set_fontname('serif') for label in labels]
plt.tight_layout()
plt.savefig('../fig/single-3dplot-1.jpg', dpi=300)