# Packages
import numpy as np
import matplotlib.pyplot as plt
from matplotlib import cm
# Use LaTeX font
plt.rcParams.update({'text.usetex': True})
# Figure font config
label_font = {'fontfamily': 'Arial Black', 'fontsize': 12}
title_font = {'fontfamily': 'Arial Black', 'fontsize': 14}
text_font = {'family': 'Palatino Linotype', 'fontsize': 12}
legend_font = {'family': 'Palatino Linotype', 'size': 12}
# Generate data
item = [
'Model 1',
'Model 2',
'Model 3',
'Model 4',
'Model 5',
]
value = np.array([
[1, 1.5, 2, 2.5, 3],
[0.2, 0.4, 0.6, 0.8, 1],
[0.1, 0.1, 0.1, 0.1, 0.1]
])
std = np.array([
[0.1, 0.15, 0.2, 0.25, 0.3],
[0.05, 0.05, 0.05, 0.05, 0.05],
[0, 0, 0, 0, 0]
])
# Plot
fig, ax = plt.subplots( 1, figsize=(4, 4))
# Config
height = 0.5
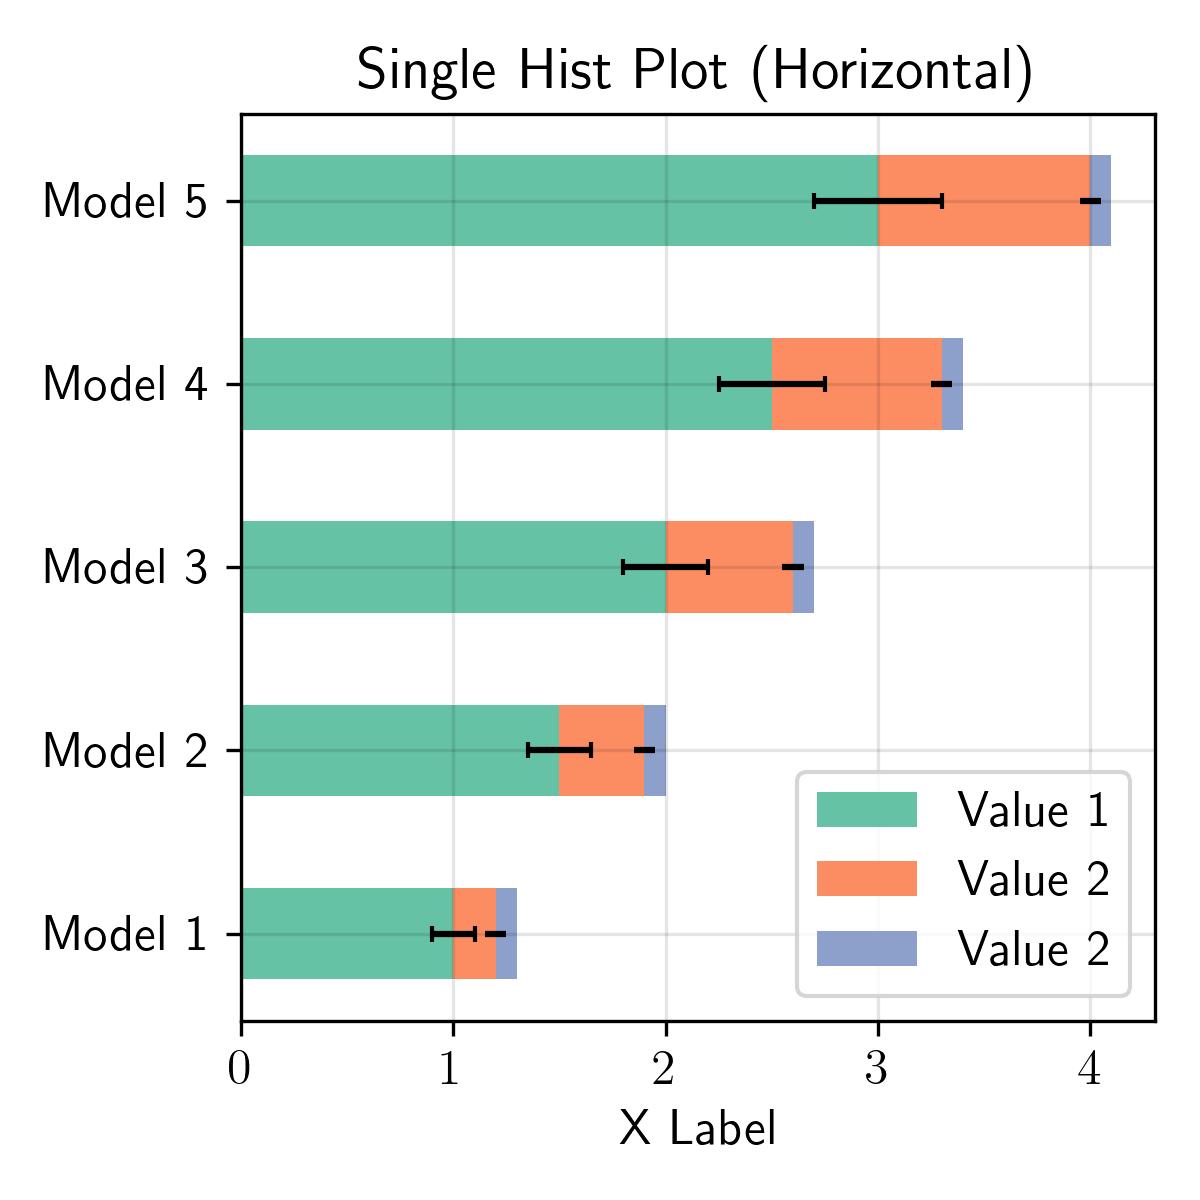
ax.barh(
item, value[0], xerr=std[0],
height=height,
color=cm.Set2(0),
label='Value 1',
capsize=2,
)
ax.barh(
item, value[1], xerr=std[1],
left=value[0],
height=height,
color=cm.Set2(1),
label='Value 2'
)
ax.barh(
item, value[2], xerr=std[2],
left=value[0] + value[1],
height=height,
color=cm.Set2(2),
label='Value 2'
)
# Label and title
ax.set_xlabel('X Label', **label_font)
ax.set_title('Single Hist Plot (Horizontal)', **title_font)
# Legend
ax.legend(loc='lower right', prop=legend_font)
# Axis
ax.tick_params(axis='both', which='major', labelsize=12)
# Grid
ax.grid(axis='both', color='black', alpha=0.1)
plt.tight_layout()
plt.savefig('../fig/single-hist-horizon.jpg', dpi=300)