# Packages
import numpy as np
import matplotlib.pyplot as plt
from matplotlib import cm
# Use LaTeX font
plt.rcParams.update({'text.usetex': True})
# Figure font config
label_font = {'fontfamily': 'Arial Black', 'fontsize': 14}
title_font = {'fontfamily': 'Arial Black', 'fontsize': 16}
legend_font = {'family': 'Palatino Linotype', 'size': 12}
text_font = {'family': 'Palatino Linotype', 'size': 12}
# Generate data
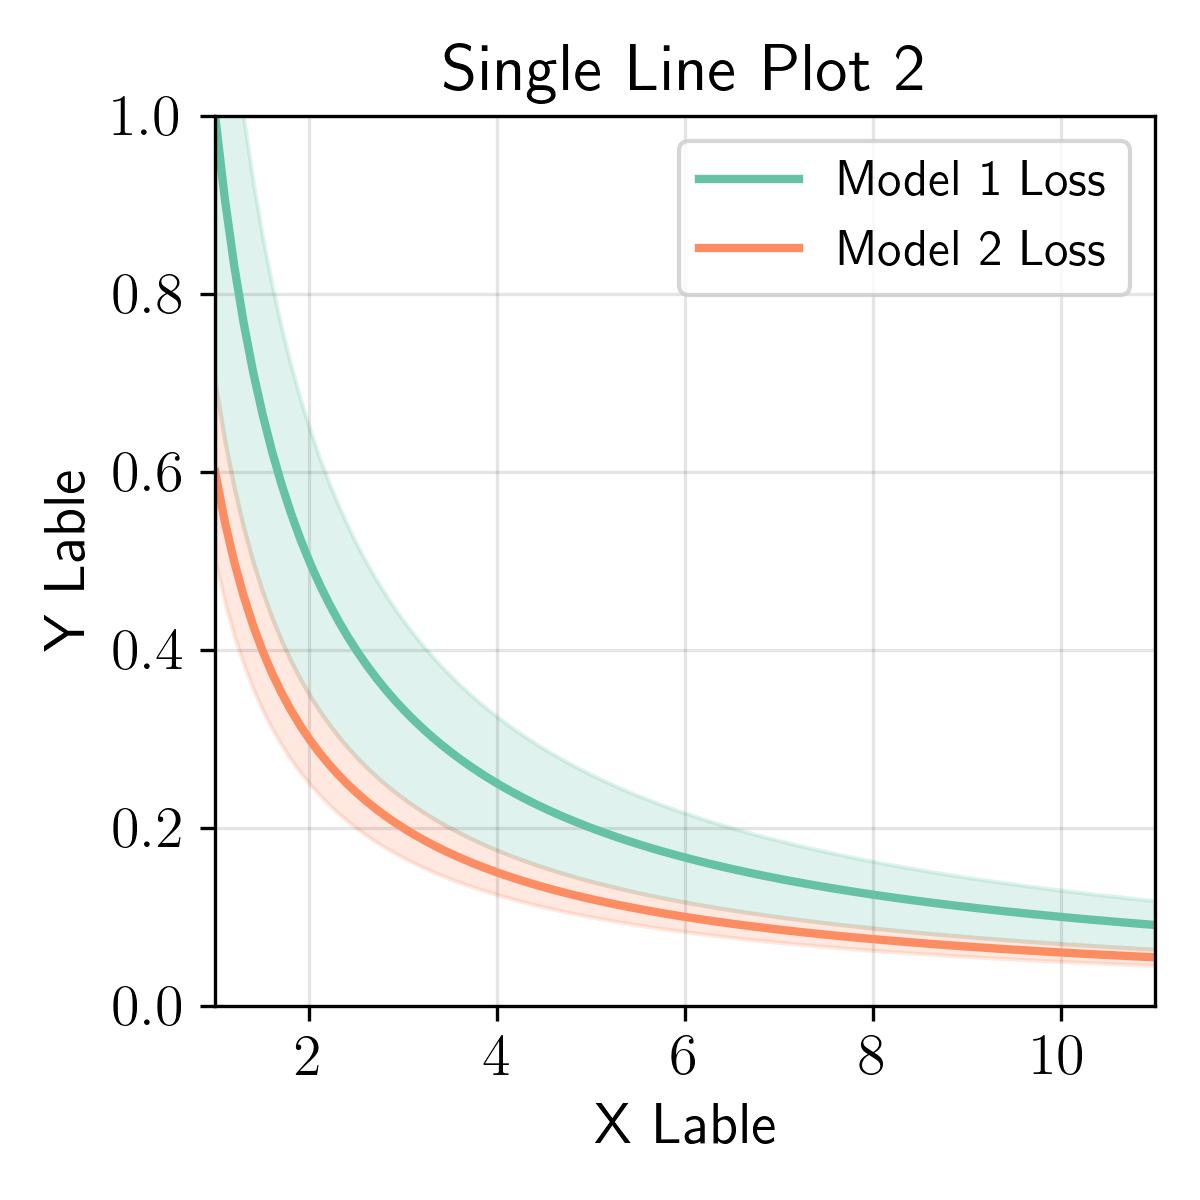
x = np.linspace(0, 10, 100) + 1
# Line plot
y1_mean = 1/x
y1_std = 0.3/x
y2_mean = 0.6/x
y2_std = 0.1/x
fig, ax = plt.subplots(1, figsize=(4, 4))
ax.plot(x, y1_mean, label='Model 1 Loss', color=cm.Set2(0), linestyle='-', linewidth=2)
ax.plot(x, y2_mean, label='Model 2 Loss', color=cm.Set2(1), linestyle='-', linewidth=2)
ax.fill_between(x, y1_mean - y1_std, y1_mean + y1_std, color=cm.Set2(0), alpha=0.2)
ax.fill_between(x, y2_mean - y2_std, y2_mean + y2_std, color=cm.Set2(1), alpha=0.2)
# Label and title
ax.set_xlabel('X Lable', fontdict=label_font)
ax.set_ylabel('Y Lable', fontdict=label_font)
ax.set_title('Single Line Plot 2', fontdict=title_font)
# Legend
ax.legend(loc='upper right', prop=legend_font)
# Ticks fontsize and font family
ax.tick_params(axis='both', which='major', labelsize=14)
labels = ax.get_xticklabels() + ax.get_yticklabels()
[label.set_fontname('serif') for label in labels]
# Axis range
ax.set_xlim(1, 11)
ax.set_ylim(0, 1)
# Grid
ax.grid(axis='both', color='black', alpha=0.1)
plt.tight_layout()
plt.savefig('../fig/single-linear-2.jpg', dpi=300)