# Packages
import numpy as np
import matplotlib.pyplot as plt
from matplotlib import cm
# Use LaTeX font
plt.rcParams.update({'text.usetex': True})
# Figure font config
label_font = {'fontfamily': 'Arial Black', 'fontsize': 14}
title_font = {'fontfamily': 'Arial Black', 'fontsize': 16}
legend_font = {'family': 'Palatino Linotype', 'size': 10}
text_font = {'family': 'Palatino Linotype', 'fontsize': 12}
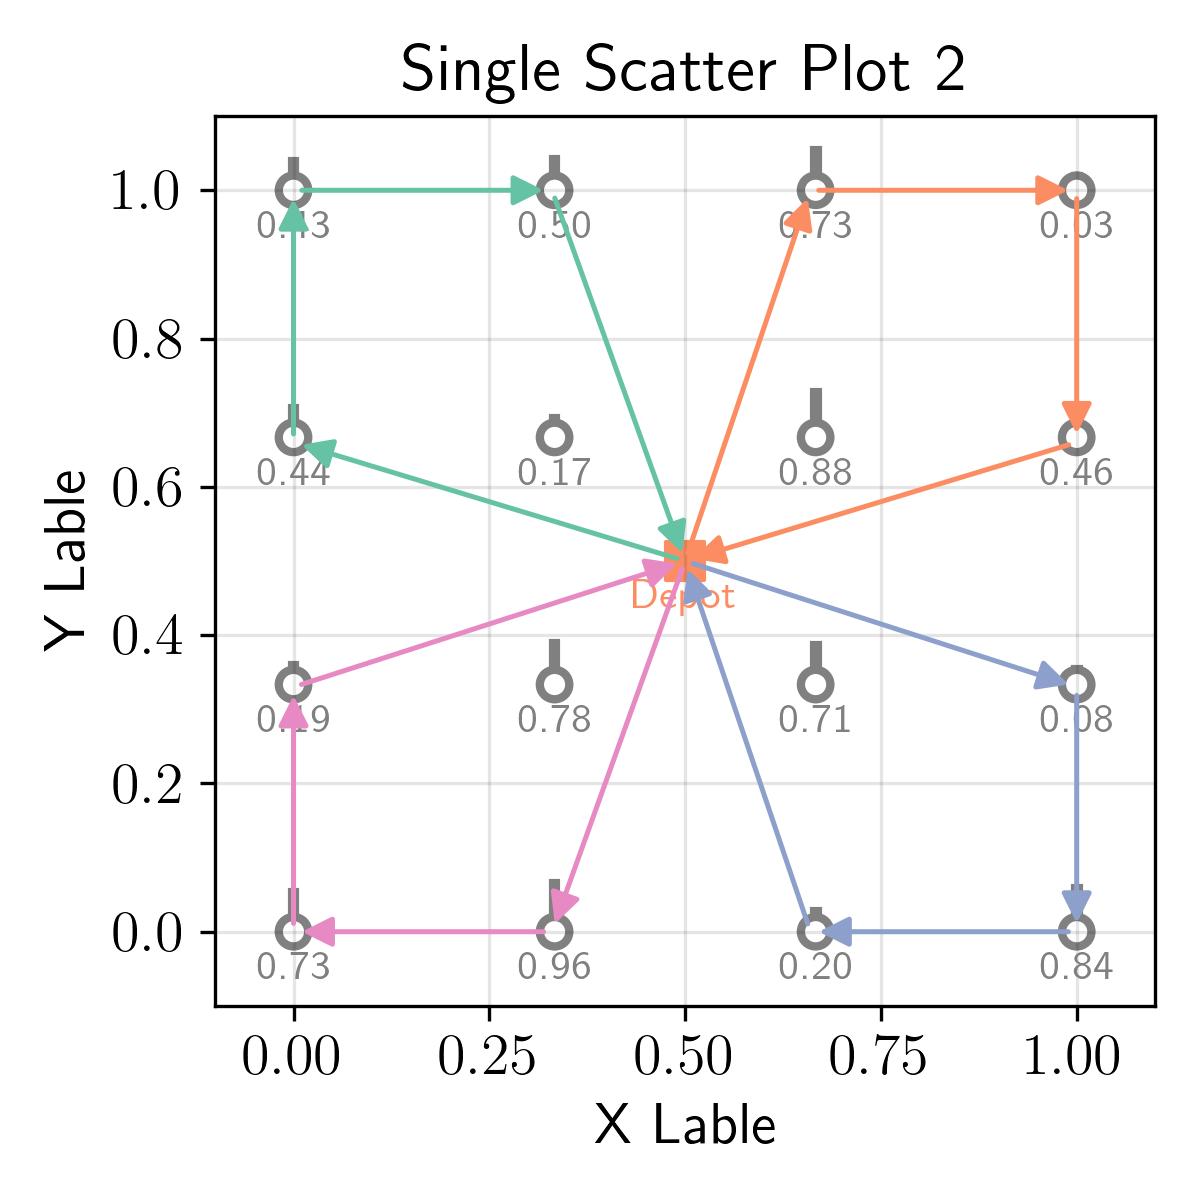
# Generate data
depot = [0.5, 0.5]
nodes_x, nodes_y = np.meshgrid(
np.linspace(0, 1, 4),
np.linspace(0, 1, 4)
)
node_prob = np.random.rand(4, 4)
routing_x = [
[0.5, 0, 0, 0.33, 0.5],
[0.5, 0.66, 1, 1, 0.5],
[0.5, 1, 1, 0.66, 0.5],
[0.5, 0.33, 0, 0, 0.5]
]
routing_y = [
[0.5, 0.66, 1, 1, 0.5],
[0.5, 1, 1, 0.66, 0.5],
[0.5, 0.33, 0, 0, 0.5],
[0.5, 0, 0, 0.33, 0.5]
]
# Plot
fig, ax = plt.subplots(1, figsize=(4, 4))
# Scatter node
ax.scatter(
nodes_x, nodes_y,
edgecolors='gray',
facecolors='none',
marker='o',
linewidths=2,
s=50
)
ax.scatter(
depot[0], depot[1],
color=cm.Set2(1),
marker='s',
s=80
)
# Plot node probability bar & text
for idx, (x, y) in enumerate(zip(nodes_x.flatten(), nodes_y.flatten())):
prob = node_prob[idx // 4][idx % 4]
ax.add_patch(
plt.Rectangle(
(x - 0.005, y + 0.02),
0.01,
prob * 0.05,
edgecolor='gray',
facecolor='gray',
fill=True,
)
)
ax.text(
x, y - 0.025,
f"{prob:.2f}",
horizontalalignment="center",
verticalalignment="top",
fontsize=10,
color='gray',
)
# Text depot
ax.text(
depot[0], depot[1] - 0.025,
f"Depot",
horizontalalignment="center",
verticalalignment="top",
fontsize=10,
color=cm.Set2(1),
)
# Plot routing
for routing_idx in range(4):
for path_idx in range(4):
src_x = routing_x[routing_idx][path_idx]
src_y = routing_y[routing_idx][path_idx]
dst_x = routing_x[routing_idx][path_idx + 1]
dst_y = routing_y[routing_idx][path_idx + 1]
ax.annotate(
"",
xy=(dst_x, dst_y),
xytext=(src_x, src_y),
arrowprops=dict(
arrowstyle="-|>",
color=cm.Set2(routing_idx),
lw=1.2,
),
size=15,
annotation_clip=False,
)
# Axis range
ax.set_xlim(-0.1, 1.1)
ax.set_ylim(-0.1, 1.1)
# Label and title
ax.set_xlabel('X Lable', fontdict=label_font)
ax.set_ylabel('Y Lable', fontdict=label_font)
ax.set_title('Single Scatter Plot 2', fontdict=title_font)
# Ticks fontsize and font family
ax.tick_params(axis='both', which='major', labelsize=14)
labels = ax.get_xticklabels() + ax.get_yticklabels()
[label.set_fontname('serif') for label in labels]
# Grid
ax.grid(axis='both', color='black', alpha=0.1)
plt.tight_layout()
plt.savefig('../fig/single-scatter-2.jpg', dpi=300)