# Packages
import numpy as np
import matplotlib.pyplot as plt
from matplotlib import cm
# Use LaTeX font
plt.rcParams.update({'text.usetex': True})
# Figure font config
label_font = {'fontfamily': 'Arial Black', 'fontsize': 14}
title_font = {'fontfamily': 'Arial Black', 'fontsize': 16}
legend_font = {'family': 'Palatino Linotype', 'size': 10}
text_font = {'family': 'Palatino Linotype', 'fontsize': 12}
# Generate data
x = np.linspace(0, 1, 10)
y1 = [0.55] * 6 + [0.65, 0.80, 0.95, 1.2]
y2 = [0.45] * 6 + [0.35, 0.20, 0.05, -0.2]
y1 = np.array(y1)
y2 = np.array(y2)
err1_x = np.random.rand(10) * 0.05 - 0.025
err1_y = np.random.rand(10) * 0.05 - 0.025
err2_x = np.random.rand(10) * 0.05 - 0.025
err2_y = np.random.rand(10) * 0.05 - 0.025
# Plot
import matplotlib.patches as patches
fig, ax = plt.subplots(1, figsize=(3, 3))
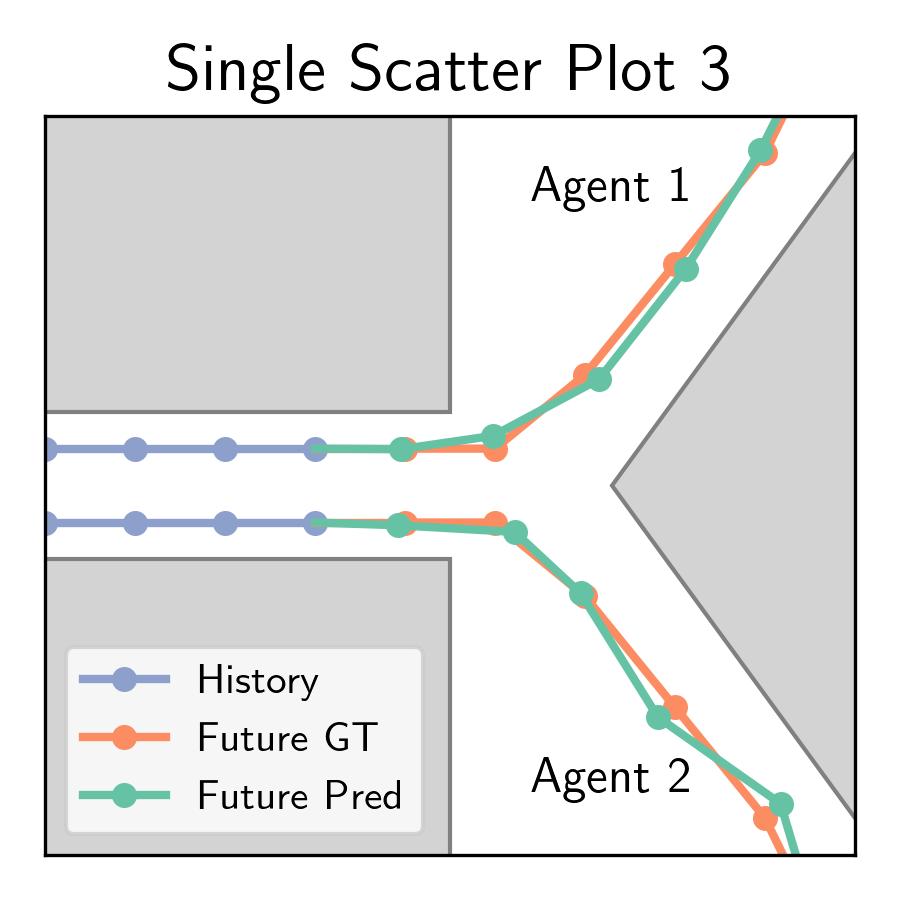
# Plot history
ax.plot( x[:4], y1[:4], label='History', color=cm.Set2(2), marker='o', lw=2, markersize=5)
ax.plot( x[:4], y2[:4], color=cm.Set2(2), marker='o', lw=2, markersize=5)
# Plot future ground truth
ax.plot( x[4:], y1[4:], label='Future GT', color=cm.Set2(1), marker='o', lw=2, markersize=5)
ax.plot( x[4:], y2[4:], color=cm.Set2(1), marker='o', lw=2, markersize=5)
# Connection
ax.plot( [x[3], x[4]], [y1[3], y1[4]], color=cm.Set2(1), lw=2, ls='-')
ax.plot( [x[3], x[4]], [y2[3], y2[4]], color=cm.Set2(1), lw=2, ls='-')
# Plot future prediction
ax.plot(x[4:]+err1_x[4:], y1[4:]+err1_y[4:], label='Future Pred', color=cm.Set2(0), marker='o', lw=2, markersize=5)
ax.plot(x[4:]+err2_x[4:], y2[4:]+err2_y[4:], color=cm.Set2(0), marker='o', lw=2, markersize=5)
# Connection
ax.plot([x[3], x[4]+err1_x[4]], [y1[3], y1[4]+err1_y[4]], color=cm.Set2(0), lw=2, ls='-')
ax.plot([x[3], x[4]+err2_x[4]], [y2[3], y2[4]+err2_y[4]], color=cm.Set2(0), lw=2, ls='-')
# Add map items
ax.add_patch(patches.Rectangle((-0.1, 0.6), 0.6, 0.6, edgecolor='grey',
facecolor='lightgrey', lw=1, fill=True,))
ax.add_patch(patches.Rectangle((-0.1, -0.1), 0.6, 0.5, edgecolor='grey',
facecolor='lightgrey', lw=1, fill=True,))
ax.add_patch(patches.Polygon([(0.7, 0.5), (1.1, 1.1), (1.1, -0.1)],
edgecolor='grey', facecolor='lightgrey', lw=1, fill=True,))
# Text infomation
ax.text(
0.7, 0.9,
'Agent 1',
fontdict=text_font,
color='black',
verticalalignment='center',
horizontalalignment='center'
)
ax.text(
0.7, 0.1,
'Agent 2',
fontdict=text_font,
color='black',
verticalalignment='center',
horizontalalignment='center'
)
# Legend
ax.legend(loc='lower left', prop=legend_font)
# Axis range
ax.set_xlim(0, 1)
ax.set_ylim(0, 1)
# Label and title
ax.get_xaxis().set_visible(False)
ax.get_yaxis().set_visible(False)
ax.set_title('Single Scatter Plot 3', fontdict=title_font)
plt.tight_layout()
plt.savefig('../fig/single-scatter-3.jpg', dpi=300)