# Packages
import numpy as np
import matplotlib.pyplot as plt
import matplotlib.patches as patches
from matplotlib import cm
# Use LaTeX font
plt.rcParams.update({'text.usetex': True})
# Figure font config
label_font = {'fontfamily': 'Arial Black', 'fontsize': 14}
title_font = {'fontfamily': 'Arial Black', 'fontsize': 16}
legend_font = {'family': 'Palatino Linotype', 'size': 10}
text_font = {'family': 'Palatino Linotype', 'fontsize': 12}
# Load data
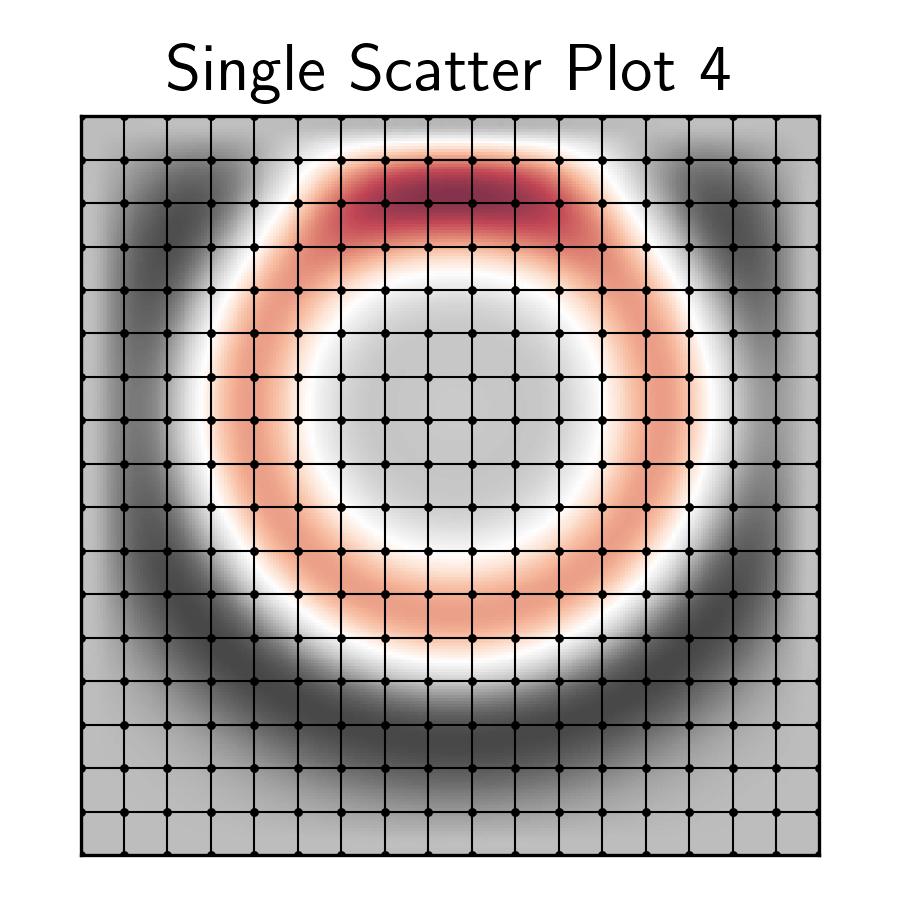
value = np.load('../data/single-scatter-4-value.npy')
x = np.linspace(0, 256, 18, endpoint=True)
y = np.linspace(0, 256, 18, endpoint=True)
# Plot
fig, ax = plt.subplots(1, figsize=(3, 3))
# Plot background value
ax.matshow(value, cmap=cm.RdGy, alpha=0.8)
# Collocation Point
for i in x:
for j in y:
ax.scatter(i, j, color='black', marker='.', s=5)
# Mesh
for i in range(17):
for j in range(17):
ax.plot([x[i], x[i+1]], [y[j], y[j]], color='black', linewidth=0.5)
ax.plot([x[i], x[i]], [x[j], y[j+1]], color='black', linewidth=0.5)
# Axis range
ax.set_xlim(0, 256)
ax.set_ylim(0, 256)
ax.invert_yaxis()
# Label and title
ax.get_xaxis().set_visible(False)
ax.get_yaxis().set_visible(False)
ax.set_title('Single Scatter Plot 4', fontdict=title_font)
plt.tight_layout()
plt.savefig('../fig/single-scatter-4.jpg', dpi=300)