matplotlib-prefab
Figures in real conference pages
Generated by tests/render_conference_context.py. Do not edit by hand.
Each entry below is one whole body page of a conference template with a figure
from tests/data/ set into it — the venue’s own margins, running head, folio,
caption style and body type, at the width the template gives a figure. This is
the size a reader meets the figure at; tests/output/index.md shows the figures
on their own, which is a different question.
The PNGs are 200 DPI rasters and your viewer will scale them to fit, so do not
judge printed size from them. The physical numbers in the table are measured
from the compiled PDF’s own drawing transform; open page.pdf at 100% to see
the real thing.
The style values these pages were produced with are still provisional project
choices, not venue requirements. The body text is an excerpt reproduced as
typographic context and credited in
tests/fixtures/article-context/provenance.md;
the figures are synthetic evaluation data. None of these pages is a paper, a
submission or an accepted work.
Summary
| Venue | Case | Line width | Target | Drawn | Scale | Body / caption pt | Page | Status |
|---|---|---|---|---|---|---|---|---|
| ICLR 2026 | bar-signed |
139.70 mm | 69.85 mm | 69.85 mm | 1.0000 | 10.0 / 10.0 | 3 of 4 | warn |
| ICLR 2026 | line-multi |
139.70 mm | 69.85 mm | 69.85 mm | 1.0000 | 10.0 / 10.0 | 3 of 4 | warn |
| NeurIPS 2026 | bar-signed |
139.70 mm | 69.85 mm | 69.85 mm | 1.0000 | 10.0 / 10.0 | 3 of 4 | warn |
| NeurIPS 2026 | line-multi |
139.70 mm | 69.85 mm | 69.85 mm | 1.0000 | 10.0 / 10.0 | 3 of 4 | warn |
| ICML 2026 | bar-signed |
82.55 mm | 82.55 mm | 82.55 mm | 1.0000 | 10.0 / 9.0 | 2 of 3 | warn |
| ICML 2026 | line-multi |
82.55 mm | 82.55 mm | 82.55 mm | 1.0000 | 10.0 / 9.0 | 2 of 3 | warn |
| ICLR 2026 | line-multi-at-85mm |
139.70 mm | 69.85 mm | 69.85 mm | 0.8218 | 10.0 / 10.0 | 3 of 4 | warn |
visual_review is not_checked in every report and stays that way until a
person opens the PNG. A clean compile is not a legible figure.
ICLR 2026 — bar-signed
Bars crossing zero with named categories — the case where the category labels run out of room first.
ICLR 2026 body, finalcopy mode, 1 column(s). Figure width rule: 0.5 * linewidth_at_insertion_point.
| Measurement | Value | Where it came from |
|---|---|---|
| text width | 139.70 mm | \textwidth, measured by TeX in the document |
| column width | 139.70 mm | \columnwidth, same |
| line width at the float | 139.70 mm | \linewidth inside the figure |
| target width | 69.85 mm | line width x 0.5 |
| source figure width | 69.85 mm | the figure PDF’s media box |
| drawn width | 69.85 mm | the page’s drawing transform |
| scale | 1.0000 | drawn / source |
| body type | 10.0 pt | \f@size in body text |
| caption type | 10.0 pt | \f@size inside the caption |
| figure axis labels | 9.0 pt drawn -> 9.00 pt printed | source x scale |
| figure tick labels | 8.0 pt drawn -> 8.00 pt printed | source x scale |
| figure data lines | 1.20 pt drawn -> 1.200 pt printed | source x scale |
Checks: 12 pass, 2 warn, 0 fail, 1 not checked.
- warn —
latex_boxes: 1 overfull/underfull box warning(s). Normal in running prose; worth a look only if one names the figure.
What render.py itself said about the figure at this width — these
are the ones to look at on the page:
text_within_canvas(warn): 1 text element(s) extend past the canvas and will be clipped in the exported files. Shorten the label, rotate tick labels, or raise profile.canvas.width_mm.tick_label_overlap(warn): 2 neighbouring tick-label pair(s) overlap. This is a bounding-box heuristic: rotate the labels (profile.bar.category_label_rotation_deg), lower profile.axes.max_xticks, shorten the labels, or widen the canvas.
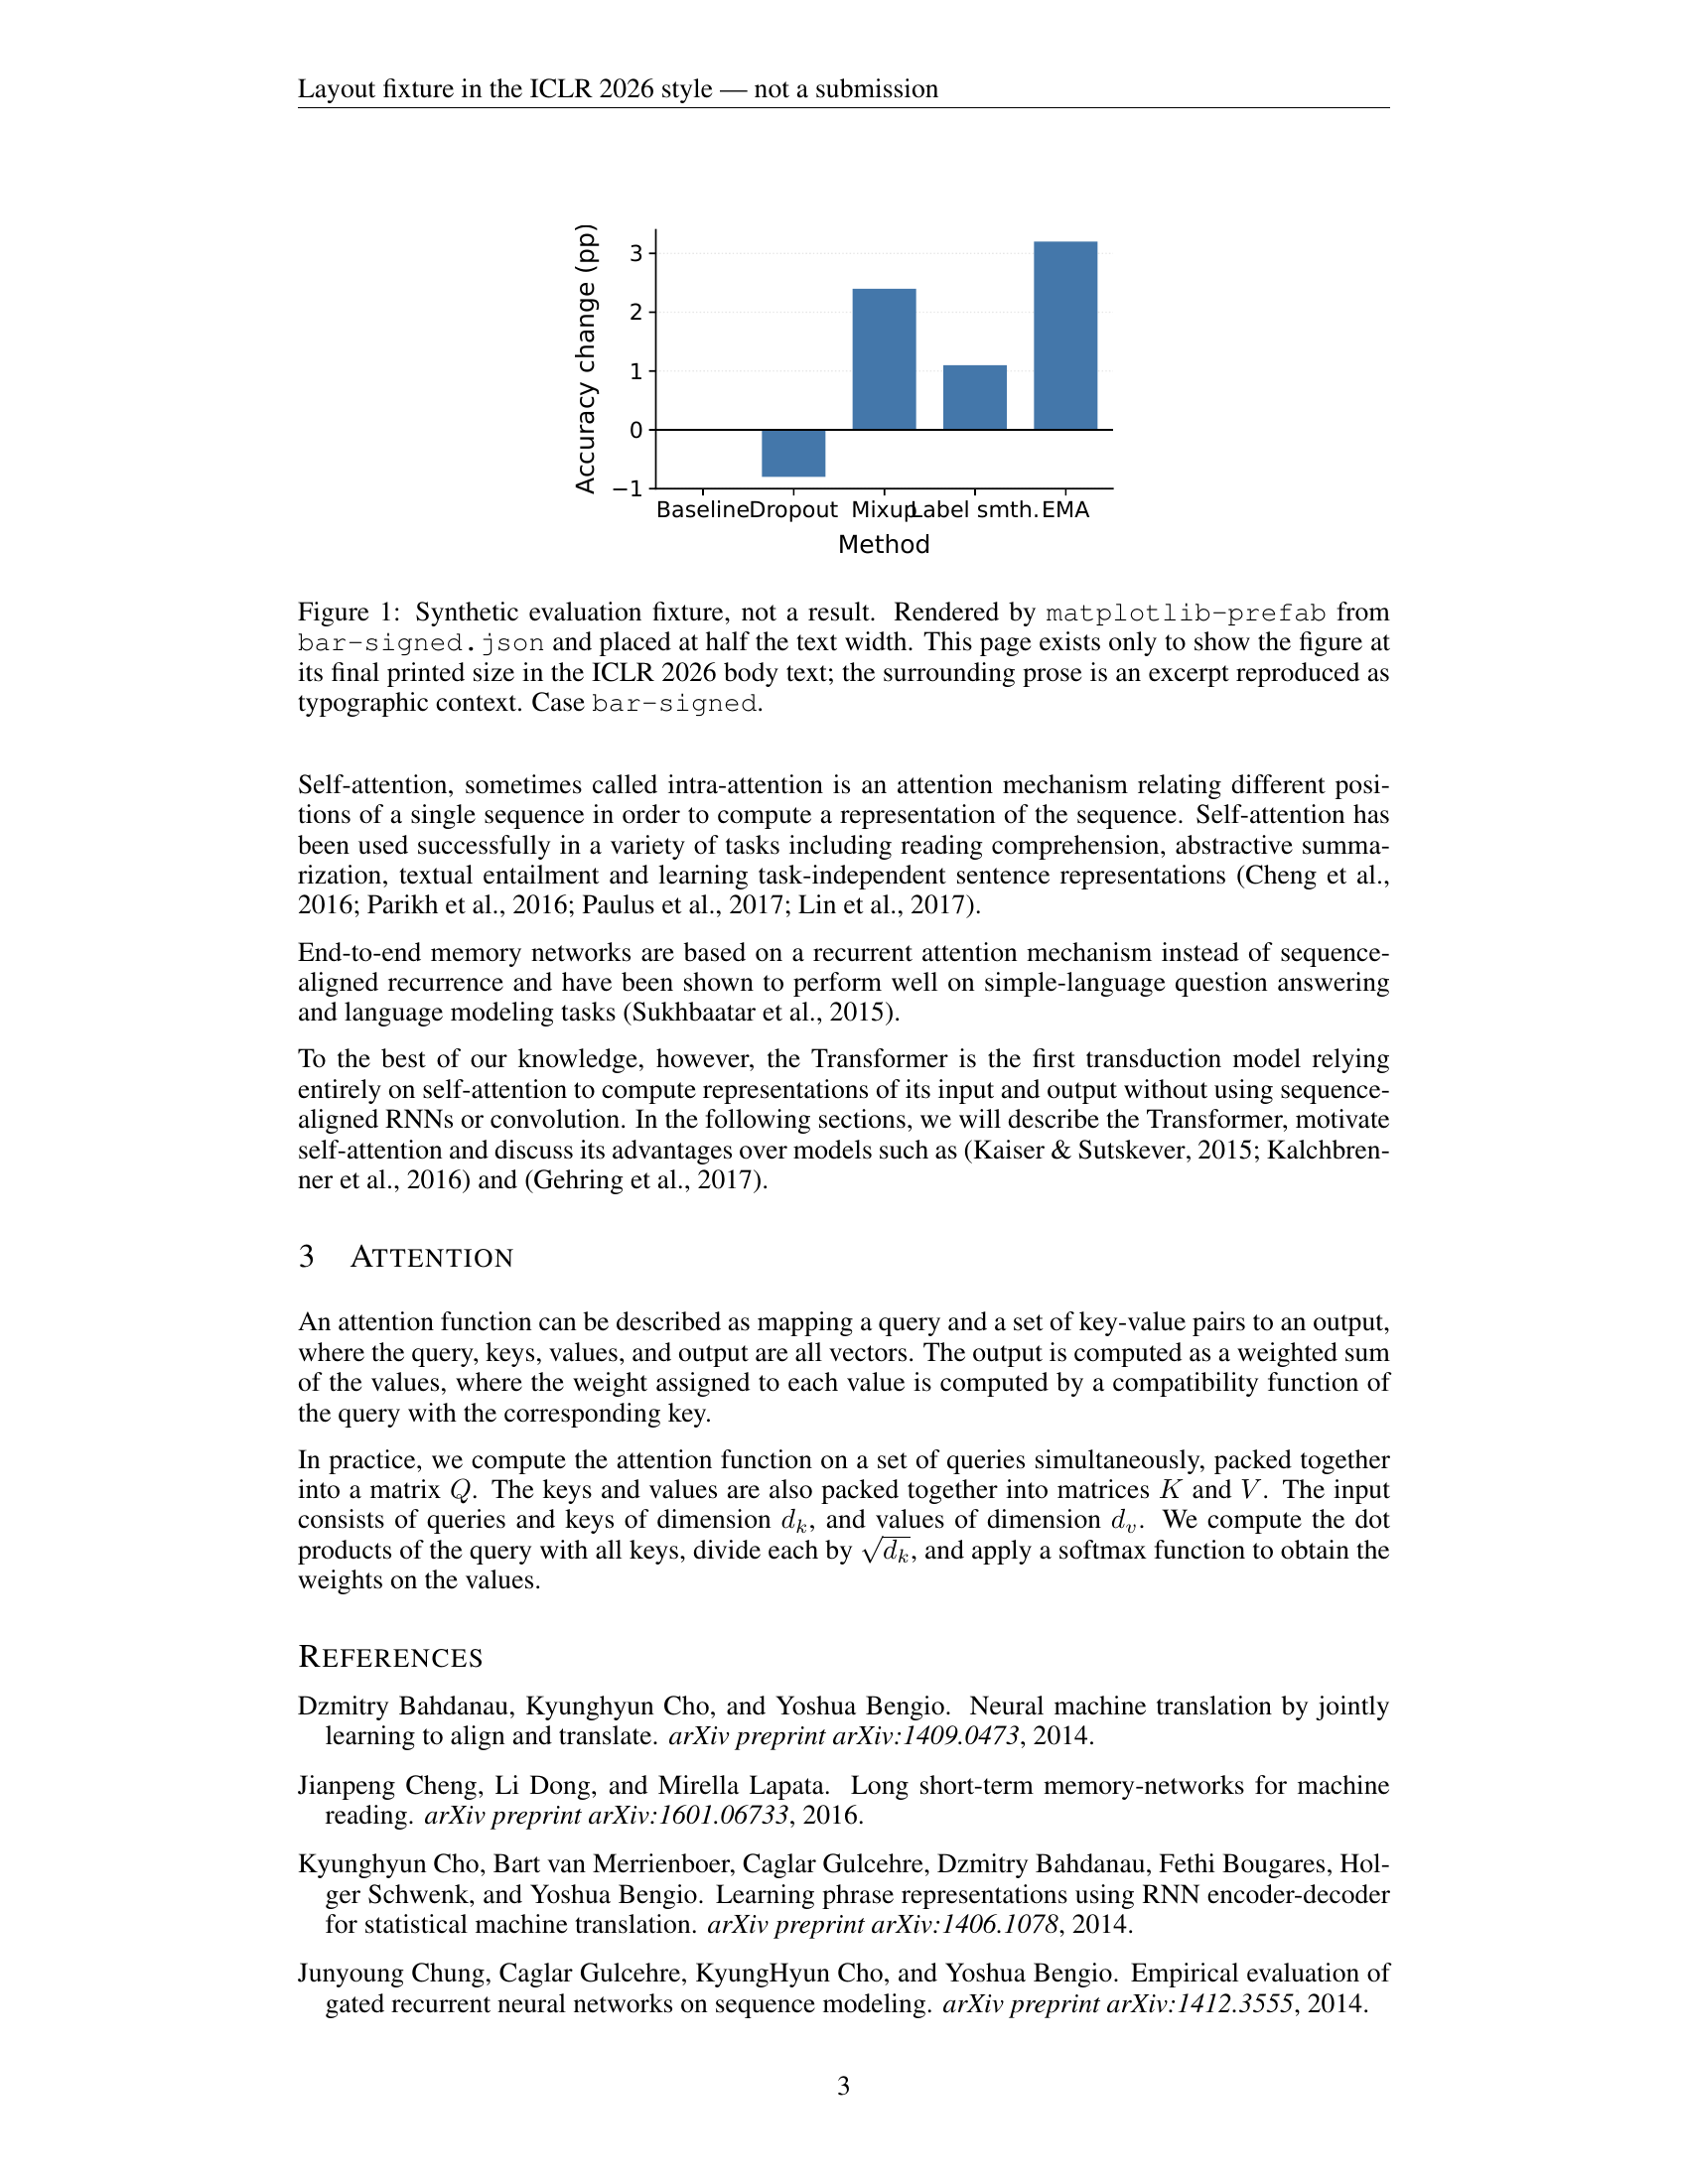
PDF: iclr2026/bar-signed/page.pdf · Report: iclr2026/bar-signed/context-report.json
ICLR 2026 — line-multi
Three series, a legend and dense tick labels — the case where a width reduction shows up first.
ICLR 2026 body, finalcopy mode, 1 column(s). Figure width rule: 0.5 * linewidth_at_insertion_point.
| Measurement | Value | Where it came from |
|---|---|---|
| text width | 139.70 mm | \textwidth, measured by TeX in the document |
| column width | 139.70 mm | \columnwidth, same |
| line width at the float | 139.70 mm | \linewidth inside the figure |
| target width | 69.85 mm | line width x 0.5 |
| source figure width | 69.85 mm | the figure PDF’s media box |
| drawn width | 69.85 mm | the page’s drawing transform |
| scale | 1.0000 | drawn / source |
| body type | 10.0 pt | \f@size in body text |
| caption type | 10.0 pt | \f@size inside the caption |
| figure axis labels | 9.0 pt drawn -> 9.00 pt printed | source x scale |
| figure tick labels | 8.0 pt drawn -> 8.00 pt printed | source x scale |
| figure data lines | 1.20 pt drawn -> 1.200 pt printed | source x scale |
Checks: 13 pass, 1 warn, 0 fail, 1 not checked.
- warn —
latex_boxes: 1 overfull/underfull box warning(s). Normal in running prose; worth a look only if one names the figure.
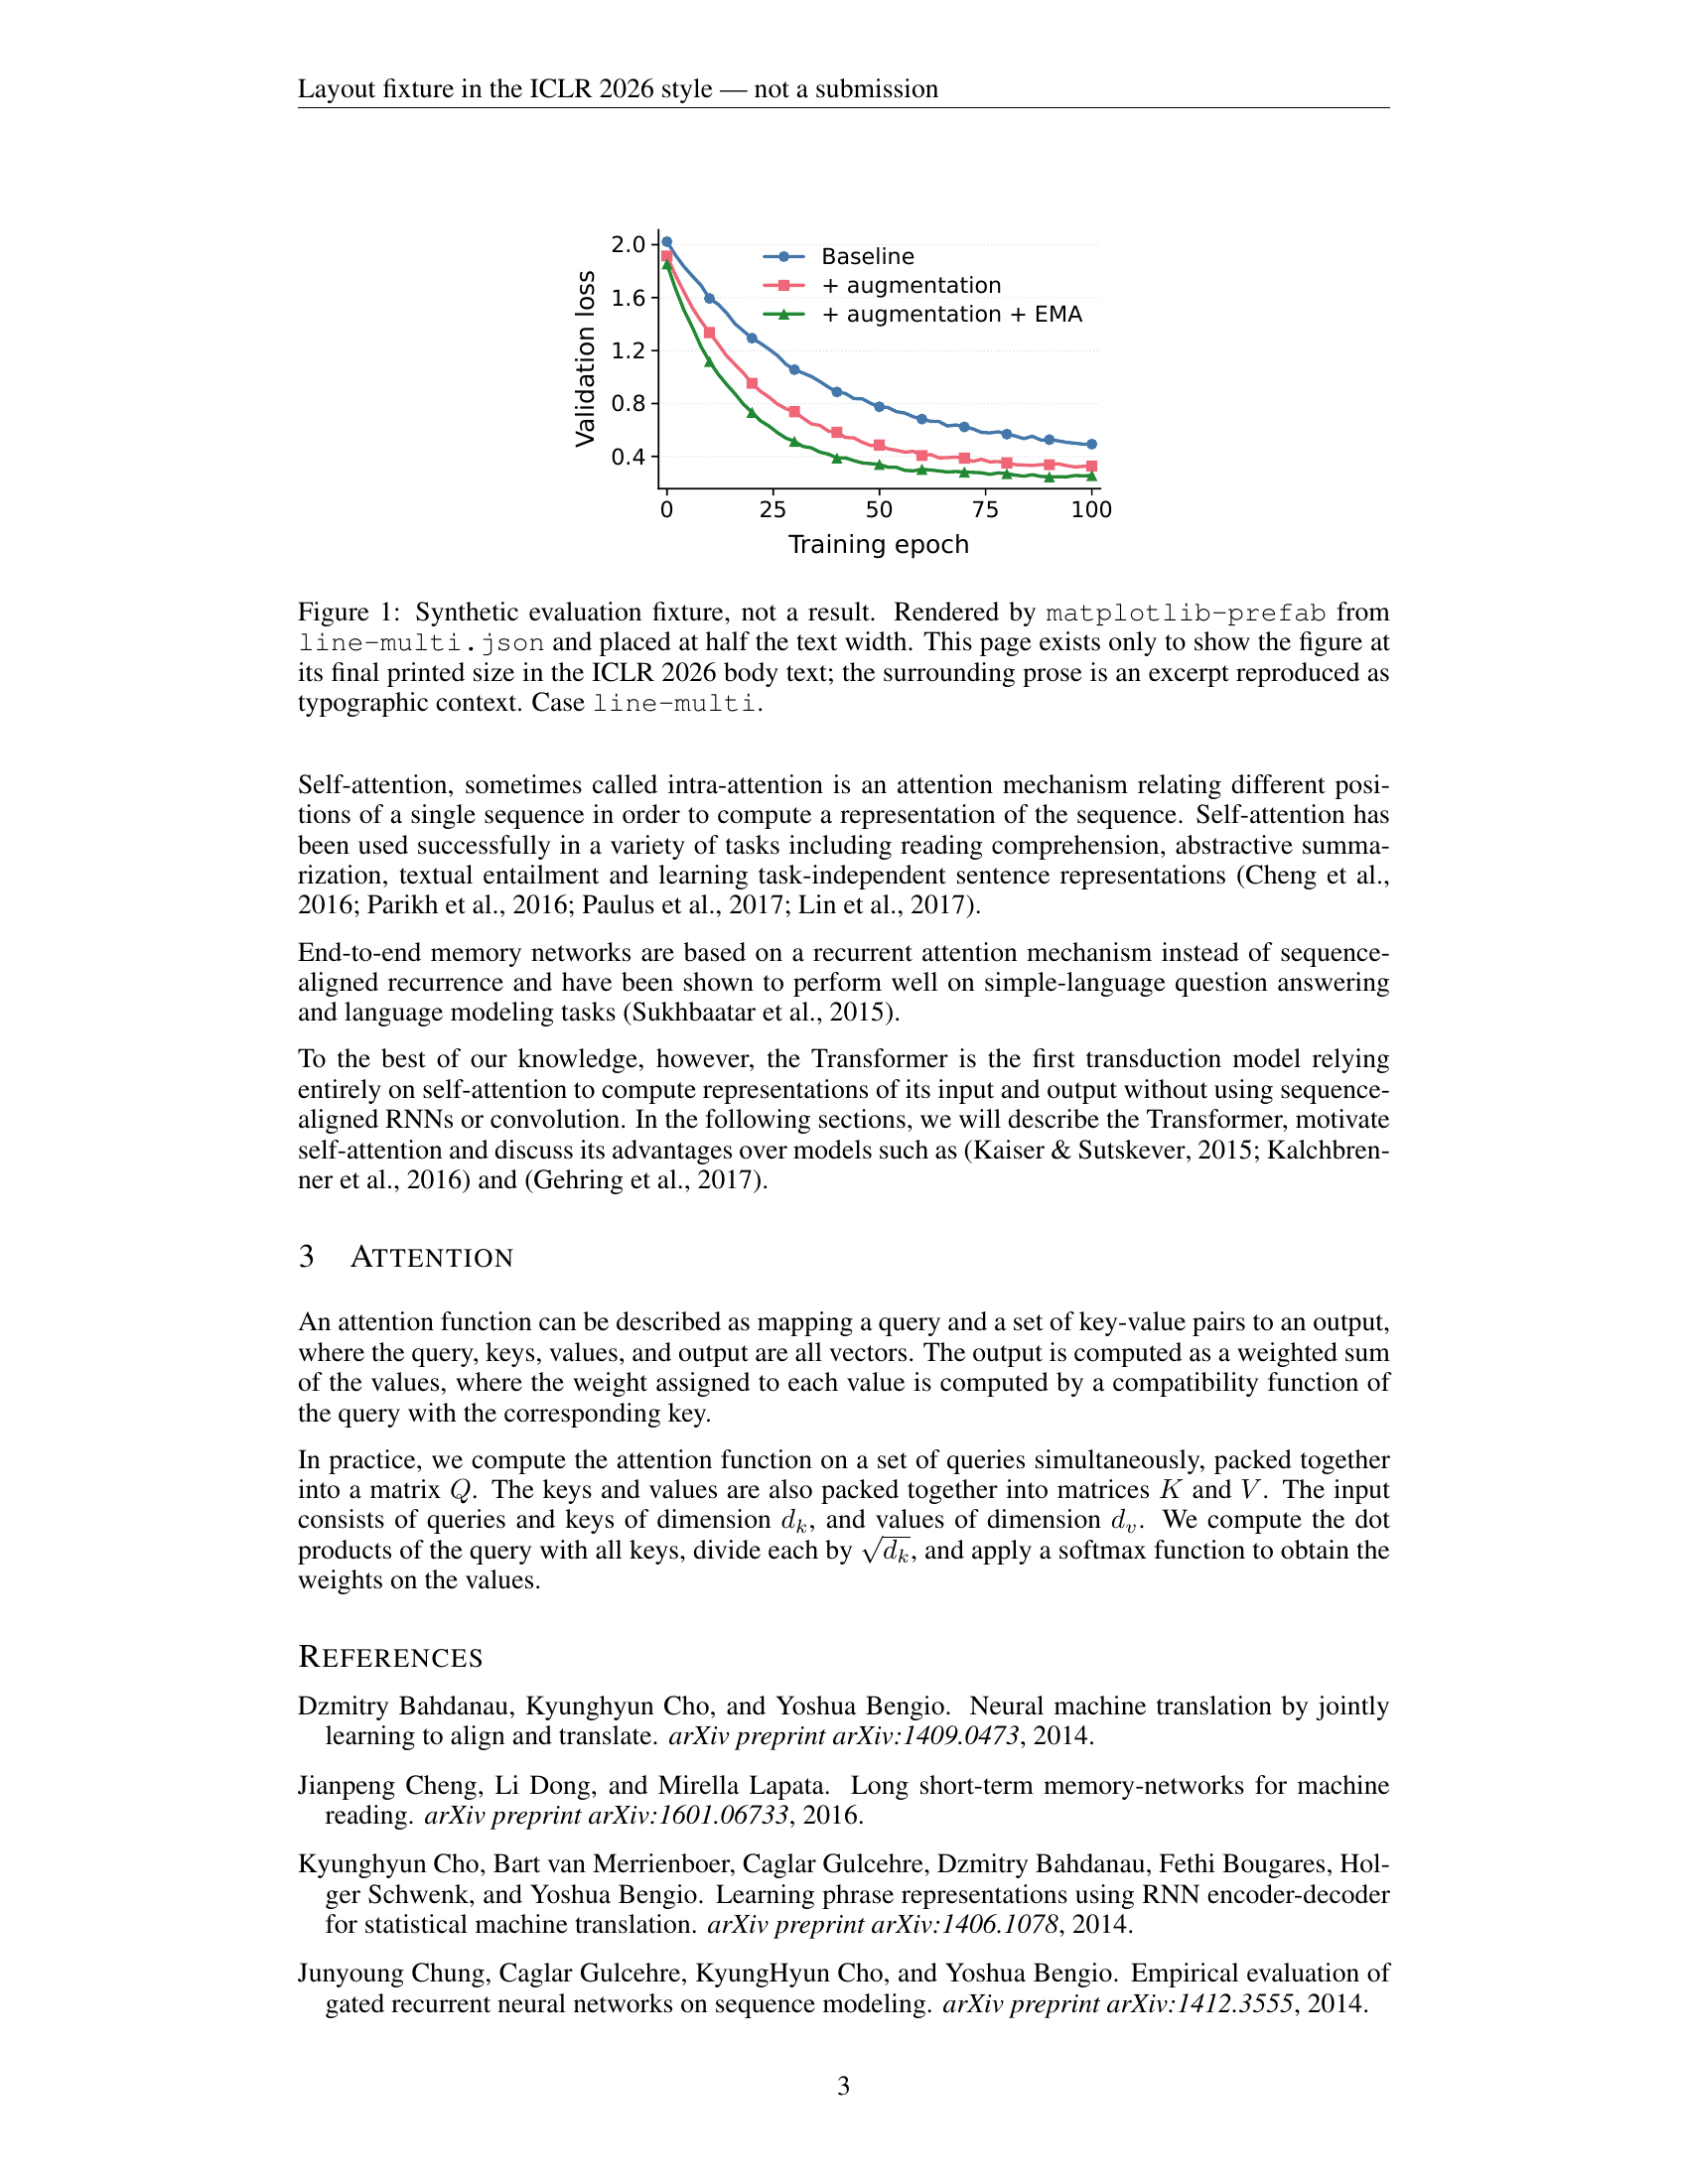
PDF: iclr2026/line-multi/page.pdf · Report: iclr2026/line-multi/context-report.json
NeurIPS 2026 — bar-signed
Bars crossing zero with named categories — the case where the category labels run out of room first.
NeurIPS 2026 body, final mode, 1 column(s). Figure width rule: 0.5 * linewidth_at_insertion_point.
| Measurement | Value | Where it came from |
|---|---|---|
| text width | 139.70 mm | \textwidth, measured by TeX in the document |
| column width | 139.70 mm | \columnwidth, same |
| line width at the float | 139.70 mm | \linewidth inside the figure |
| target width | 69.85 mm | line width x 0.5 |
| source figure width | 69.85 mm | the figure PDF’s media box |
| drawn width | 69.85 mm | the page’s drawing transform |
| scale | 1.0000 | drawn / source |
| body type | 10.0 pt | \f@size in body text |
| caption type | 10.0 pt | \f@size inside the caption |
| figure axis labels | 9.0 pt drawn -> 9.00 pt printed | source x scale |
| figure tick labels | 8.0 pt drawn -> 8.00 pt printed | source x scale |
| figure data lines | 1.20 pt drawn -> 1.200 pt printed | source x scale |
Checks: 12 pass, 2 warn, 0 fail, 1 not checked.
- warn —
latex_boxes: 1 overfull/underfull box warning(s). Normal in running prose; worth a look only if one names the figure.
What render.py itself said about the figure at this width — these
are the ones to look at on the page:
text_within_canvas(warn): 1 text element(s) extend past the canvas and will be clipped in the exported files. Shorten the label, rotate tick labels, or raise profile.canvas.width_mm.tick_label_overlap(warn): 2 neighbouring tick-label pair(s) overlap. This is a bounding-box heuristic: rotate the labels (profile.bar.category_label_rotation_deg), lower profile.axes.max_xticks, shorten the labels, or widen the canvas.
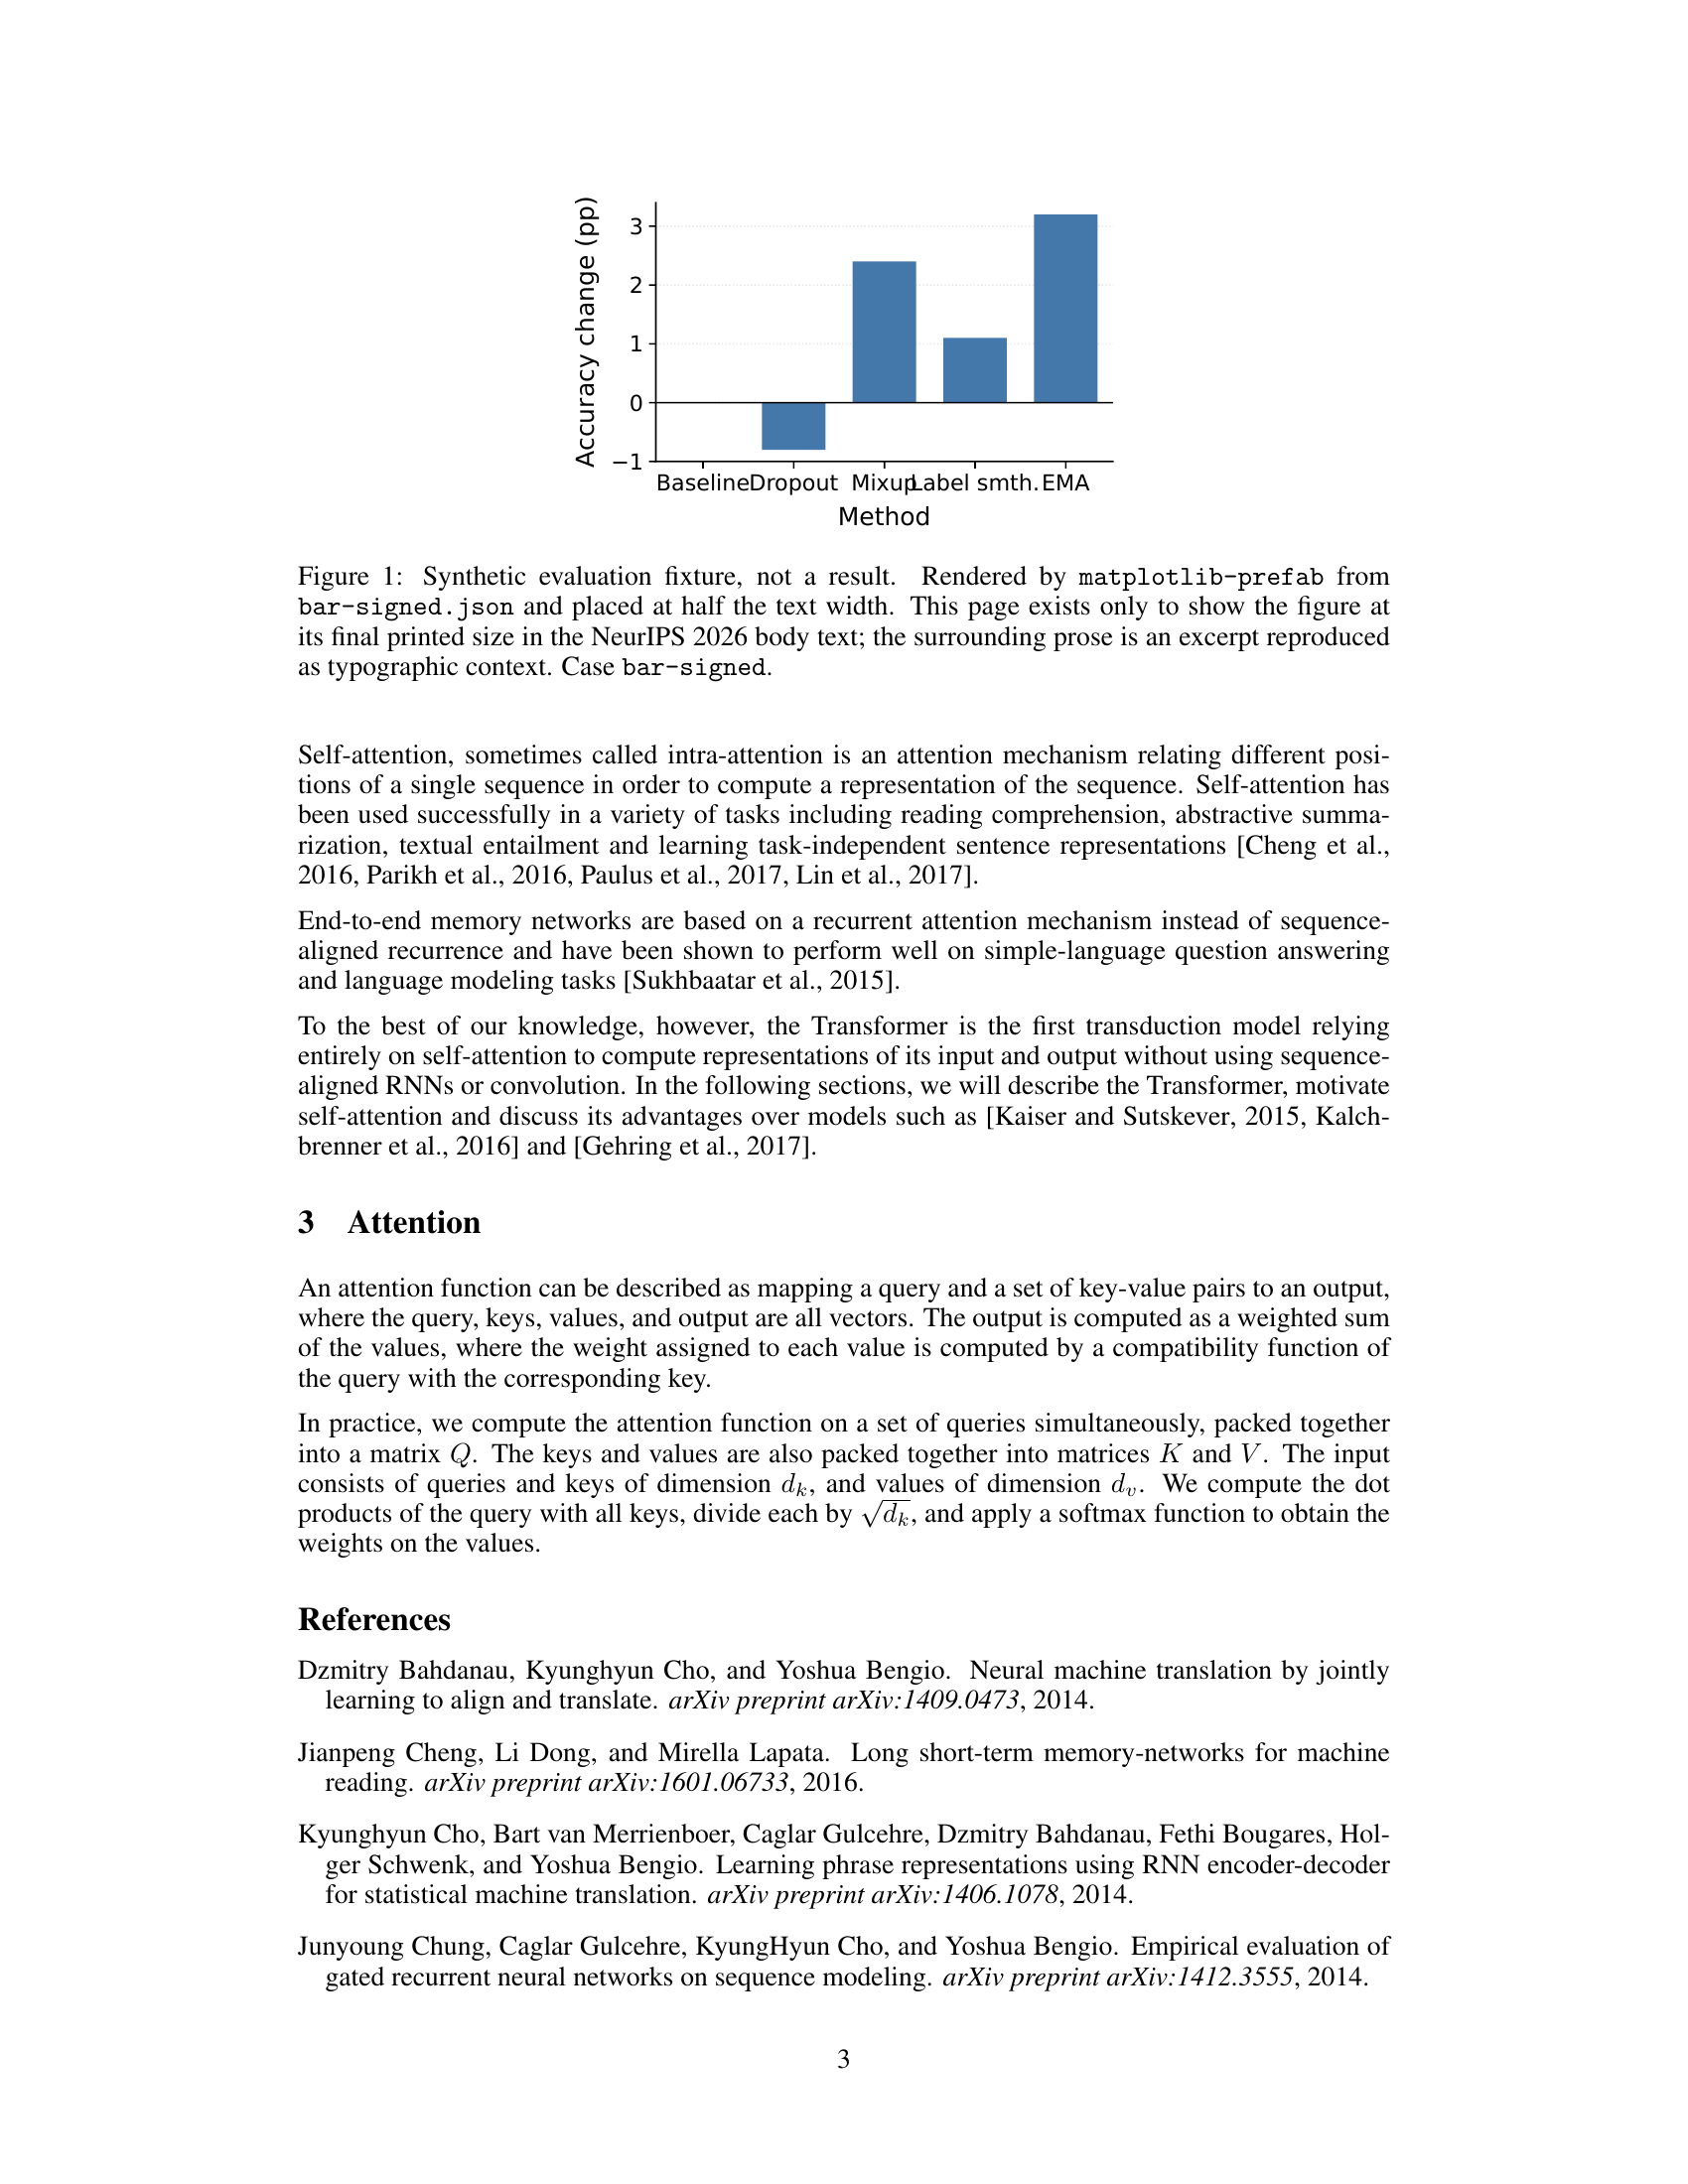
PDF: neurips2026/bar-signed/page.pdf · Report: neurips2026/bar-signed/context-report.json
NeurIPS 2026 — line-multi
Three series, a legend and dense tick labels — the case where a width reduction shows up first.
NeurIPS 2026 body, final mode, 1 column(s). Figure width rule: 0.5 * linewidth_at_insertion_point.
| Measurement | Value | Where it came from |
|---|---|---|
| text width | 139.70 mm | \textwidth, measured by TeX in the document |
| column width | 139.70 mm | \columnwidth, same |
| line width at the float | 139.70 mm | \linewidth inside the figure |
| target width | 69.85 mm | line width x 0.5 |
| source figure width | 69.85 mm | the figure PDF’s media box |
| drawn width | 69.85 mm | the page’s drawing transform |
| scale | 1.0000 | drawn / source |
| body type | 10.0 pt | \f@size in body text |
| caption type | 10.0 pt | \f@size inside the caption |
| figure axis labels | 9.0 pt drawn -> 9.00 pt printed | source x scale |
| figure tick labels | 8.0 pt drawn -> 8.00 pt printed | source x scale |
| figure data lines | 1.20 pt drawn -> 1.200 pt printed | source x scale |
Checks: 13 pass, 1 warn, 0 fail, 1 not checked.
- warn —
latex_boxes: 1 overfull/underfull box warning(s). Normal in running prose; worth a look only if one names the figure.
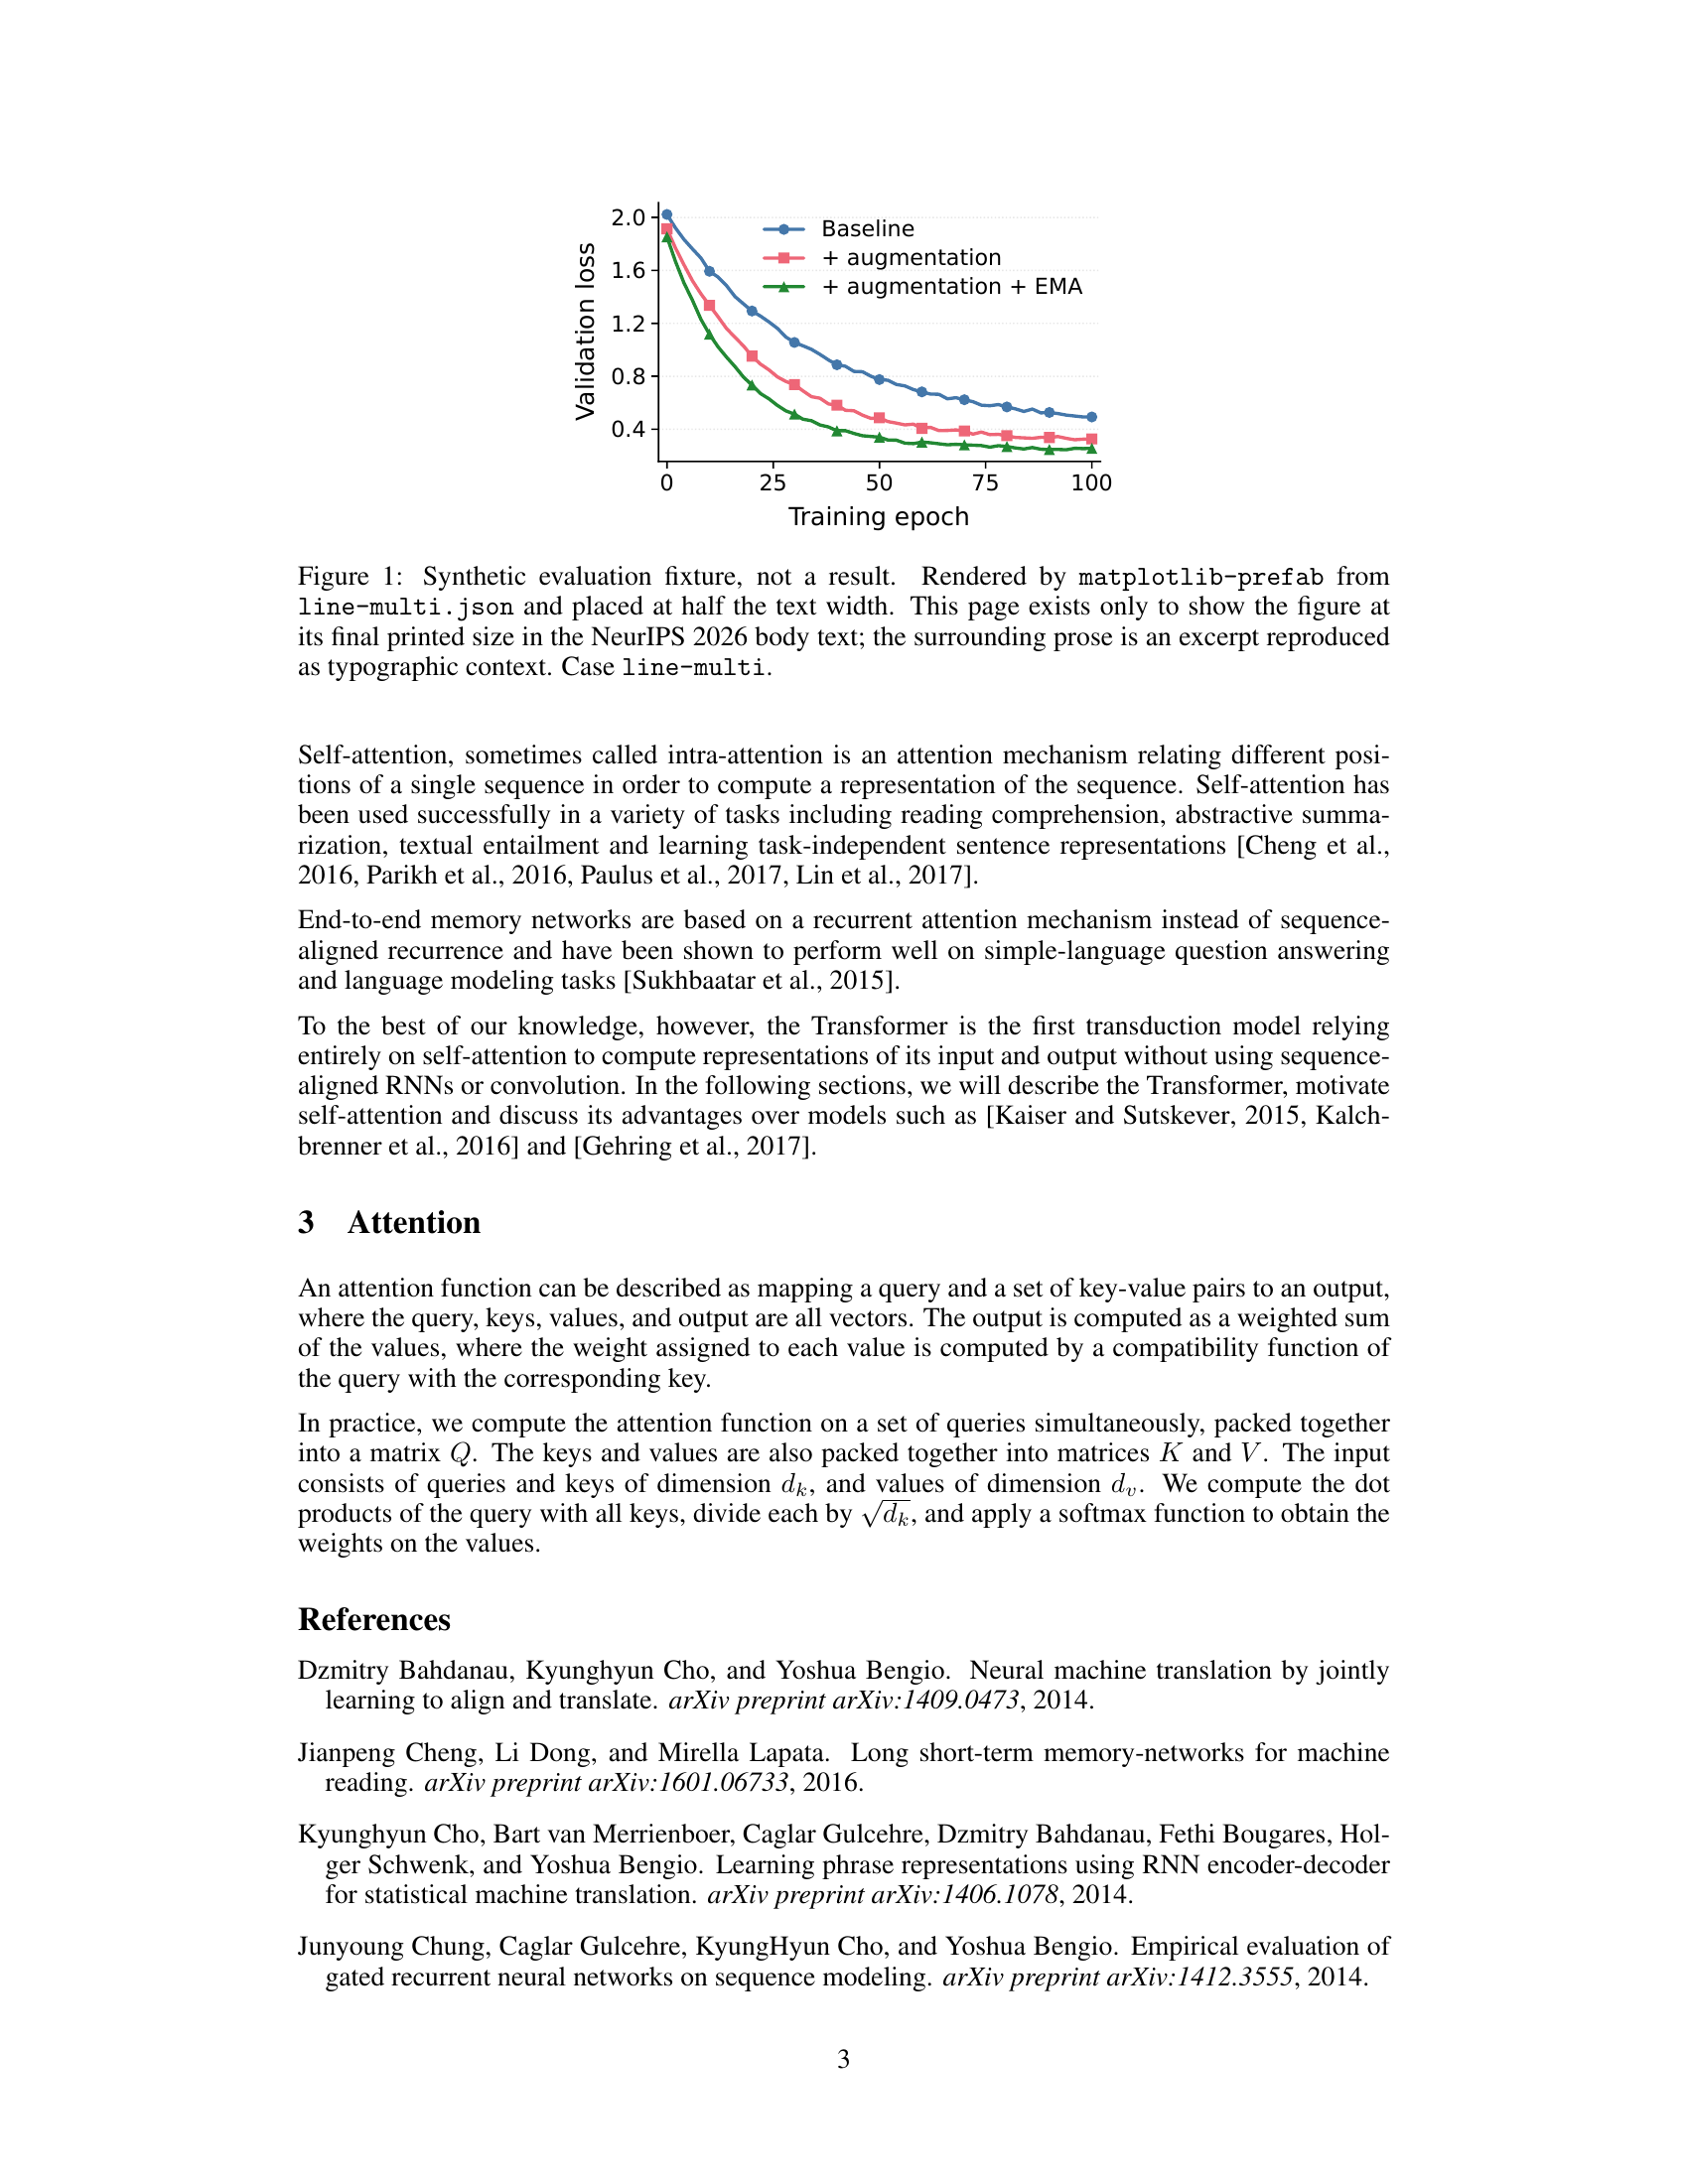
PDF: neurips2026/line-multi/page.pdf · Report: neurips2026/line-multi/context-report.json
ICML 2026 — bar-signed
Bars crossing zero with named categories — the case where the category labels run out of room first.
ICML 2026 body, accepted mode, 2 column(s). Figure width rule: 1.0 * linewidth_at_insertion_point.
| Measurement | Value | Where it came from |
|---|---|---|
| text width | 171.45 mm | \textwidth, measured by TeX in the document |
| column width | 82.55 mm | \columnwidth, same |
| line width at the float | 82.55 mm | \linewidth inside the figure |
| target width | 82.55 mm | line width x 1.0 |
| source figure width | 82.55 mm | the figure PDF’s media box |
| drawn width | 82.55 mm | the page’s drawing transform |
| scale | 1.0000 | drawn / source |
| body type | 10.0 pt | \f@size in body text |
| caption type | 9.0 pt | \f@size inside the caption |
| figure axis labels | 9.0 pt drawn -> 9.00 pt printed | source x scale |
| figure tick labels | 8.0 pt drawn -> 8.00 pt printed | source x scale |
| figure data lines | 1.20 pt drawn -> 1.200 pt printed | source x scale |
Checks: 13 pass, 1 warn, 0 fail, 1 not checked.
- warn —
latex_boxes: 9 overfull/underfull box warning(s). Normal in running prose; worth a look only if one names the figure.
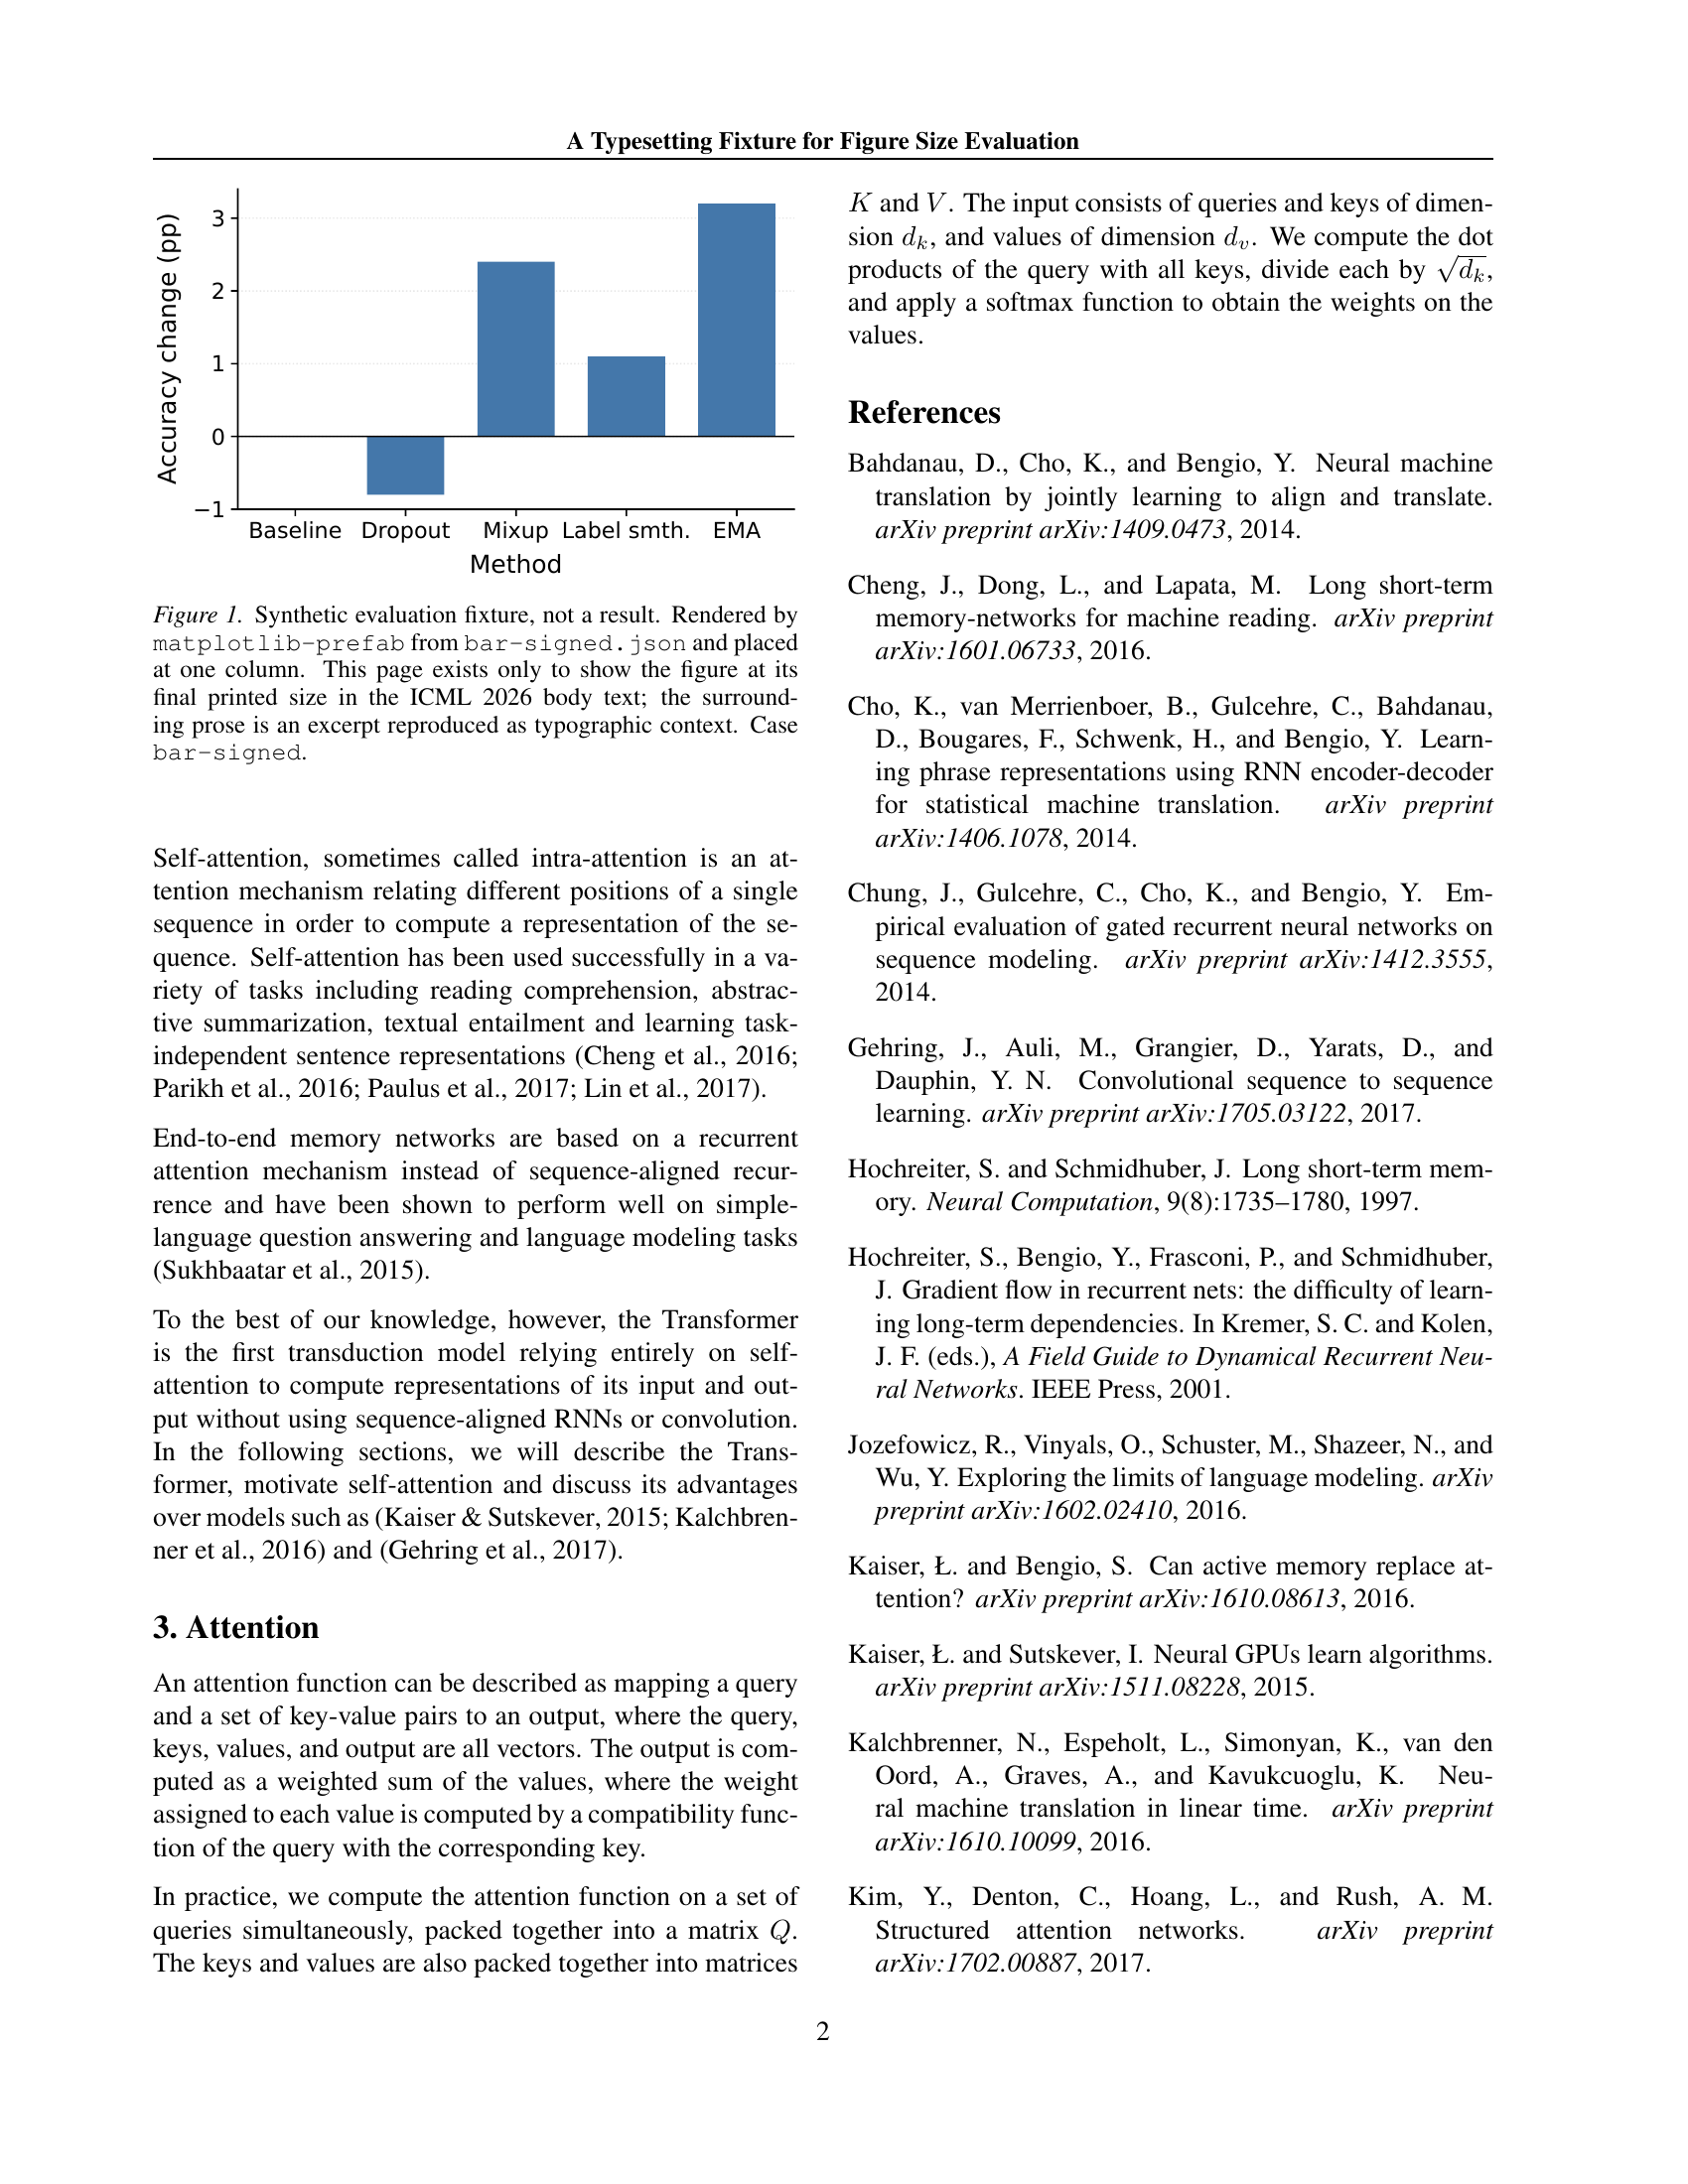
PDF: icml2026/bar-signed/page.pdf · Report: icml2026/bar-signed/context-report.json
ICML 2026 — line-multi
Three series, a legend and dense tick labels — the case where a width reduction shows up first.
ICML 2026 body, accepted mode, 2 column(s). Figure width rule: 1.0 * linewidth_at_insertion_point.
| Measurement | Value | Where it came from |
|---|---|---|
| text width | 171.45 mm | \textwidth, measured by TeX in the document |
| column width | 82.55 mm | \columnwidth, same |
| line width at the float | 82.55 mm | \linewidth inside the figure |
| target width | 82.55 mm | line width x 1.0 |
| source figure width | 82.55 mm | the figure PDF’s media box |
| drawn width | 82.55 mm | the page’s drawing transform |
| scale | 1.0000 | drawn / source |
| body type | 10.0 pt | \f@size in body text |
| caption type | 9.0 pt | \f@size inside the caption |
| figure axis labels | 9.0 pt drawn -> 9.00 pt printed | source x scale |
| figure tick labels | 8.0 pt drawn -> 8.00 pt printed | source x scale |
| figure data lines | 1.20 pt drawn -> 1.200 pt printed | source x scale |
Checks: 13 pass, 1 warn, 0 fail, 1 not checked.
- warn —
latex_boxes: 9 overfull/underfull box warning(s). Normal in running prose; worth a look only if one names the figure.
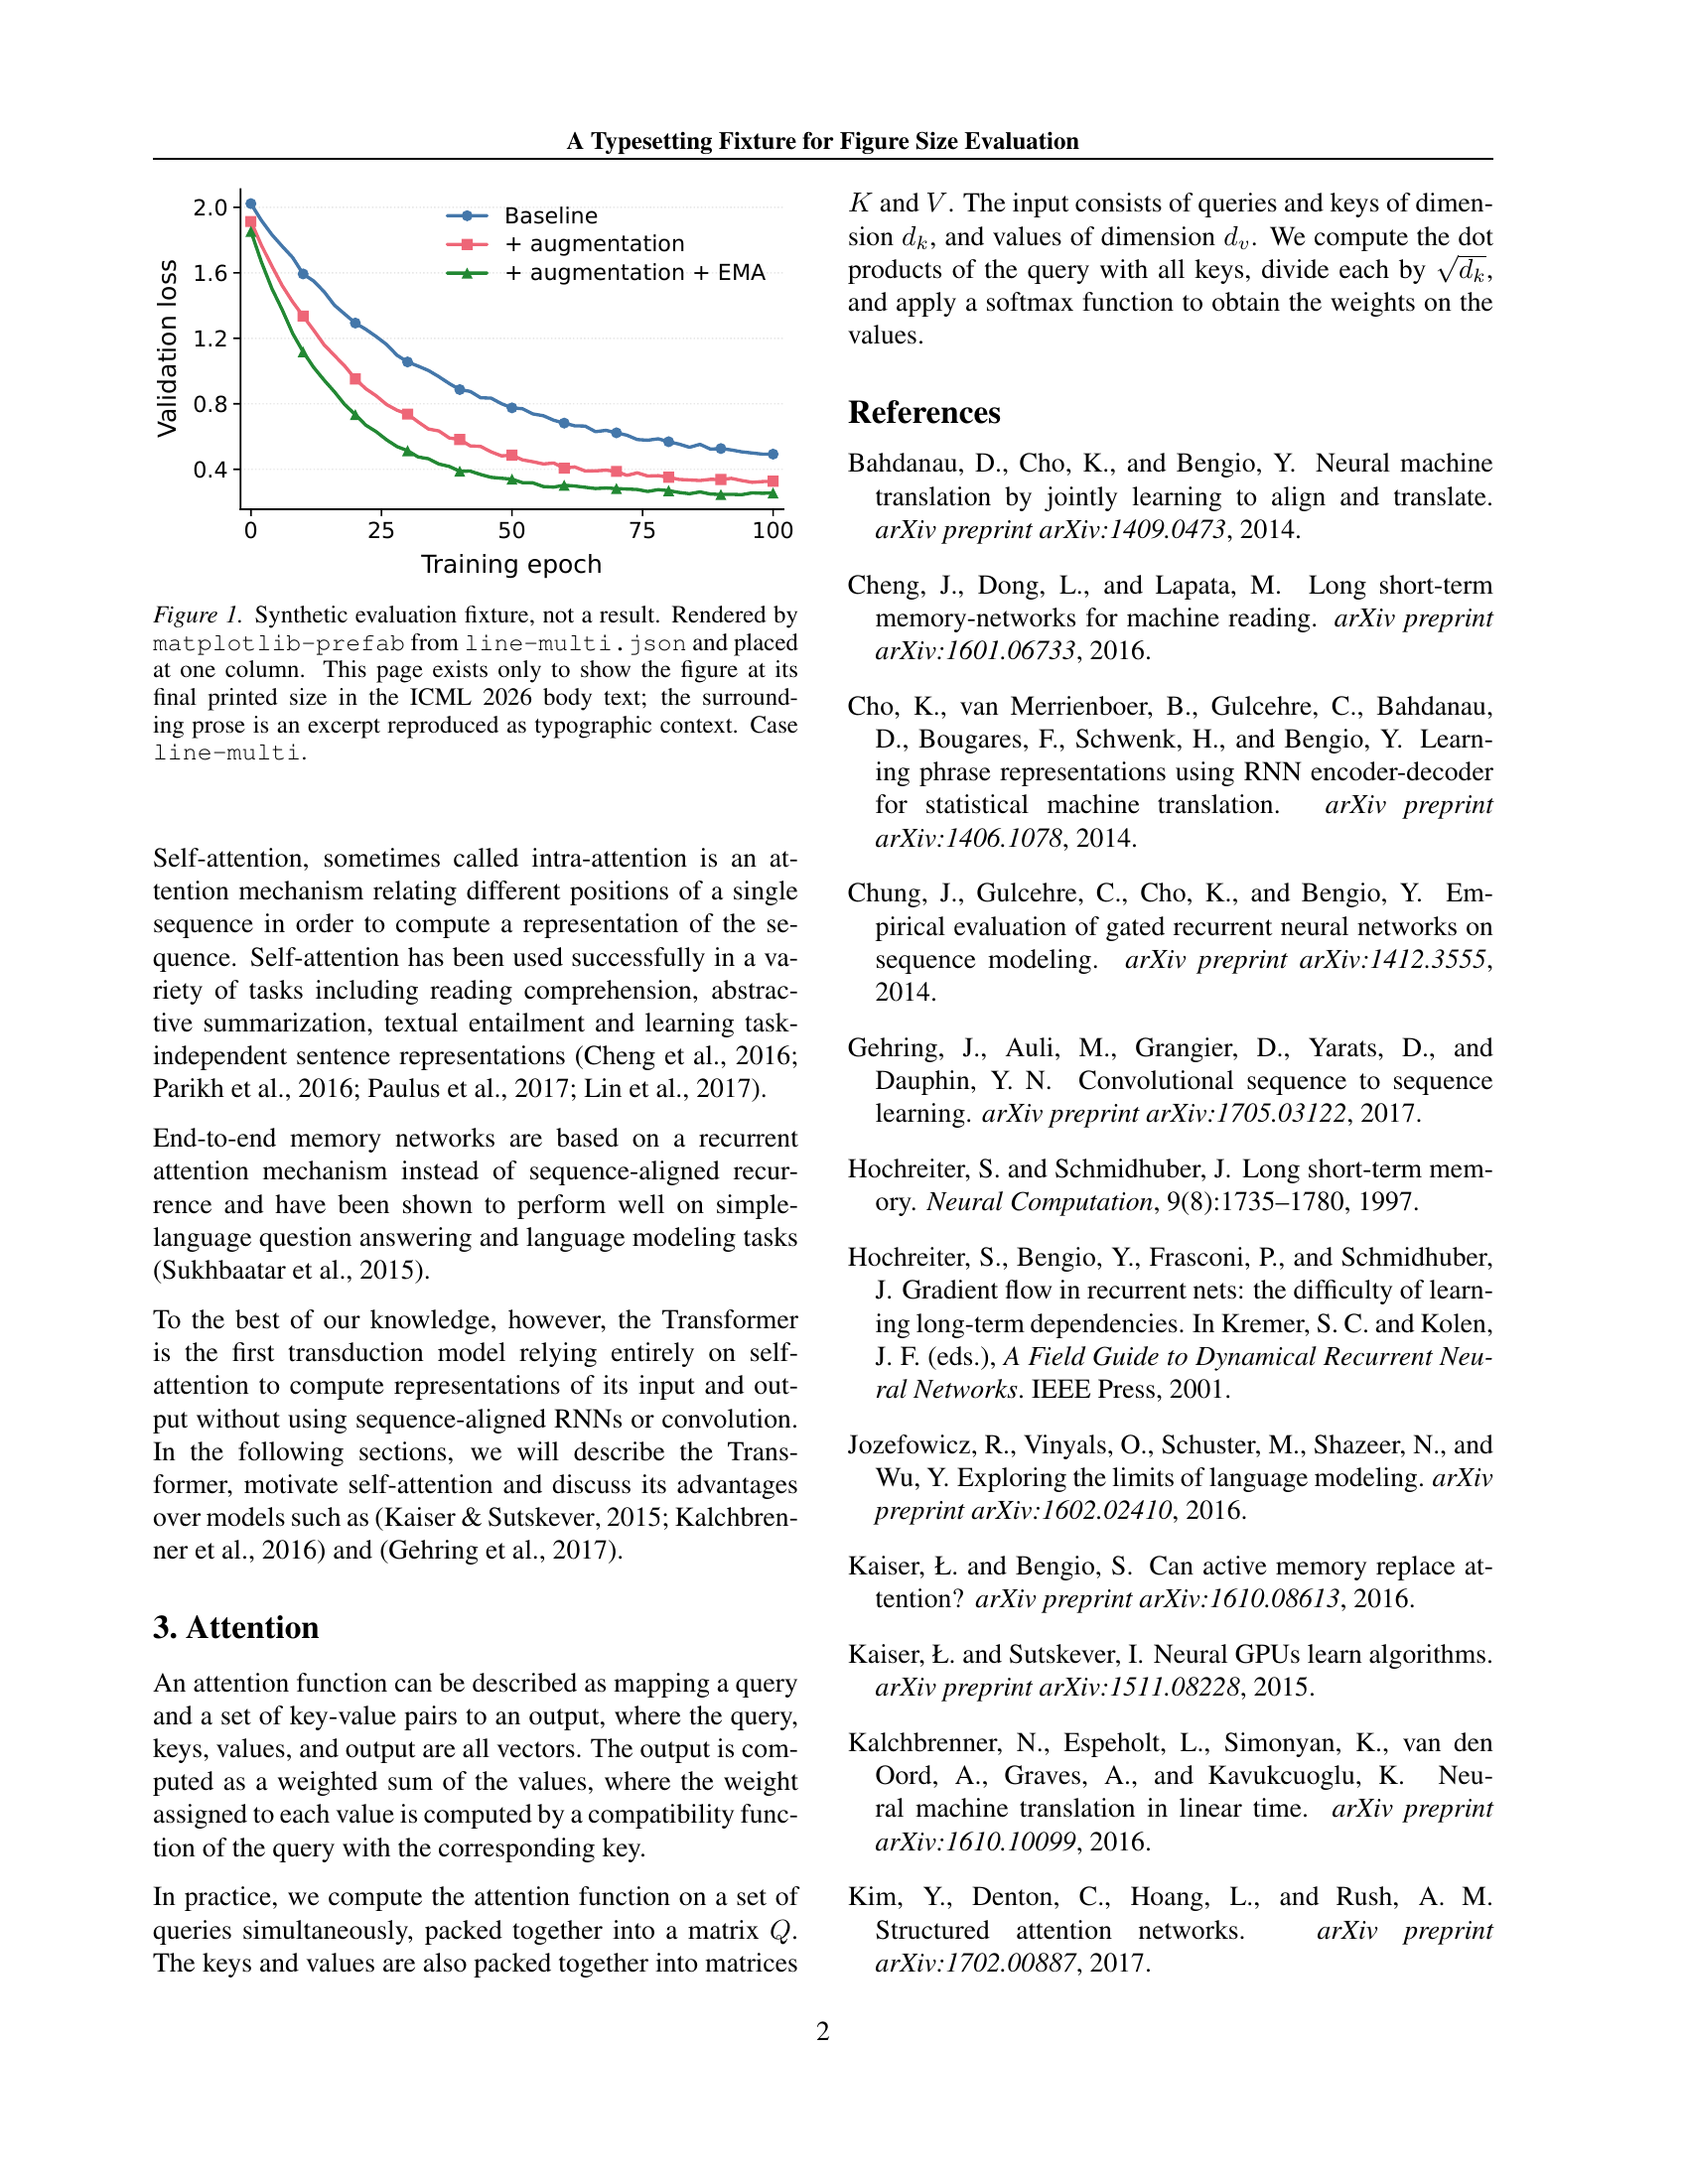
PDF: icml2026/line-multi/page.pdf · Report: icml2026/line-multi/context-report.json
ICLR 2026 — line-multi-at-85mm
Regression case: the committed 85 mm figure placed into ICLR’s half-width slot with no re-render. Expected to warn — it exists to show the scale factor and the reduced effective type sizes are really measured, not assumed.
ICLR 2026 body, finalcopy mode, 1 column(s). Figure width rule: 0.5 * linewidth_at_insertion_point.
| Measurement | Value | Where it came from |
|---|---|---|
| text width | 139.70 mm | \textwidth, measured by TeX in the document |
| column width | 139.70 mm | \columnwidth, same |
| line width at the float | 139.70 mm | \linewidth inside the figure |
| target width | 69.85 mm | line width x 0.5 |
| source figure width | 85.00 mm | the figure PDF’s media box |
| drawn width | 69.85 mm | the page’s drawing transform |
| scale | 0.8218 | drawn / source |
| body type | 10.0 pt | \f@size in body text |
| caption type | 10.0 pt | \f@size inside the caption |
| figure axis labels | 9.0 pt drawn -> 7.40 pt printed | source x scale |
| figure tick labels | 8.0 pt drawn -> 6.57 pt printed | source x scale |
| figure data lines | 1.20 pt drawn -> 0.986 pt printed | source x scale |
Checks: 11 pass, 2 warn, 0 fail, 2 not checked.
- warn —
latex_boxes: 1 overfull/underfull box warning(s). Normal in running prose; worth a look only if one names the figure. - warn —
effective_type_size: Placed at scale 0.8218: 9.0 pt axis labels print at 7.40 pt, 8.0 pt ticks at 6.57 pt, 1.20 pt data lines at 0.986 pt. Whether that is legible is a judgement, not a rule — this check reports the numbers and does not set a threshold.
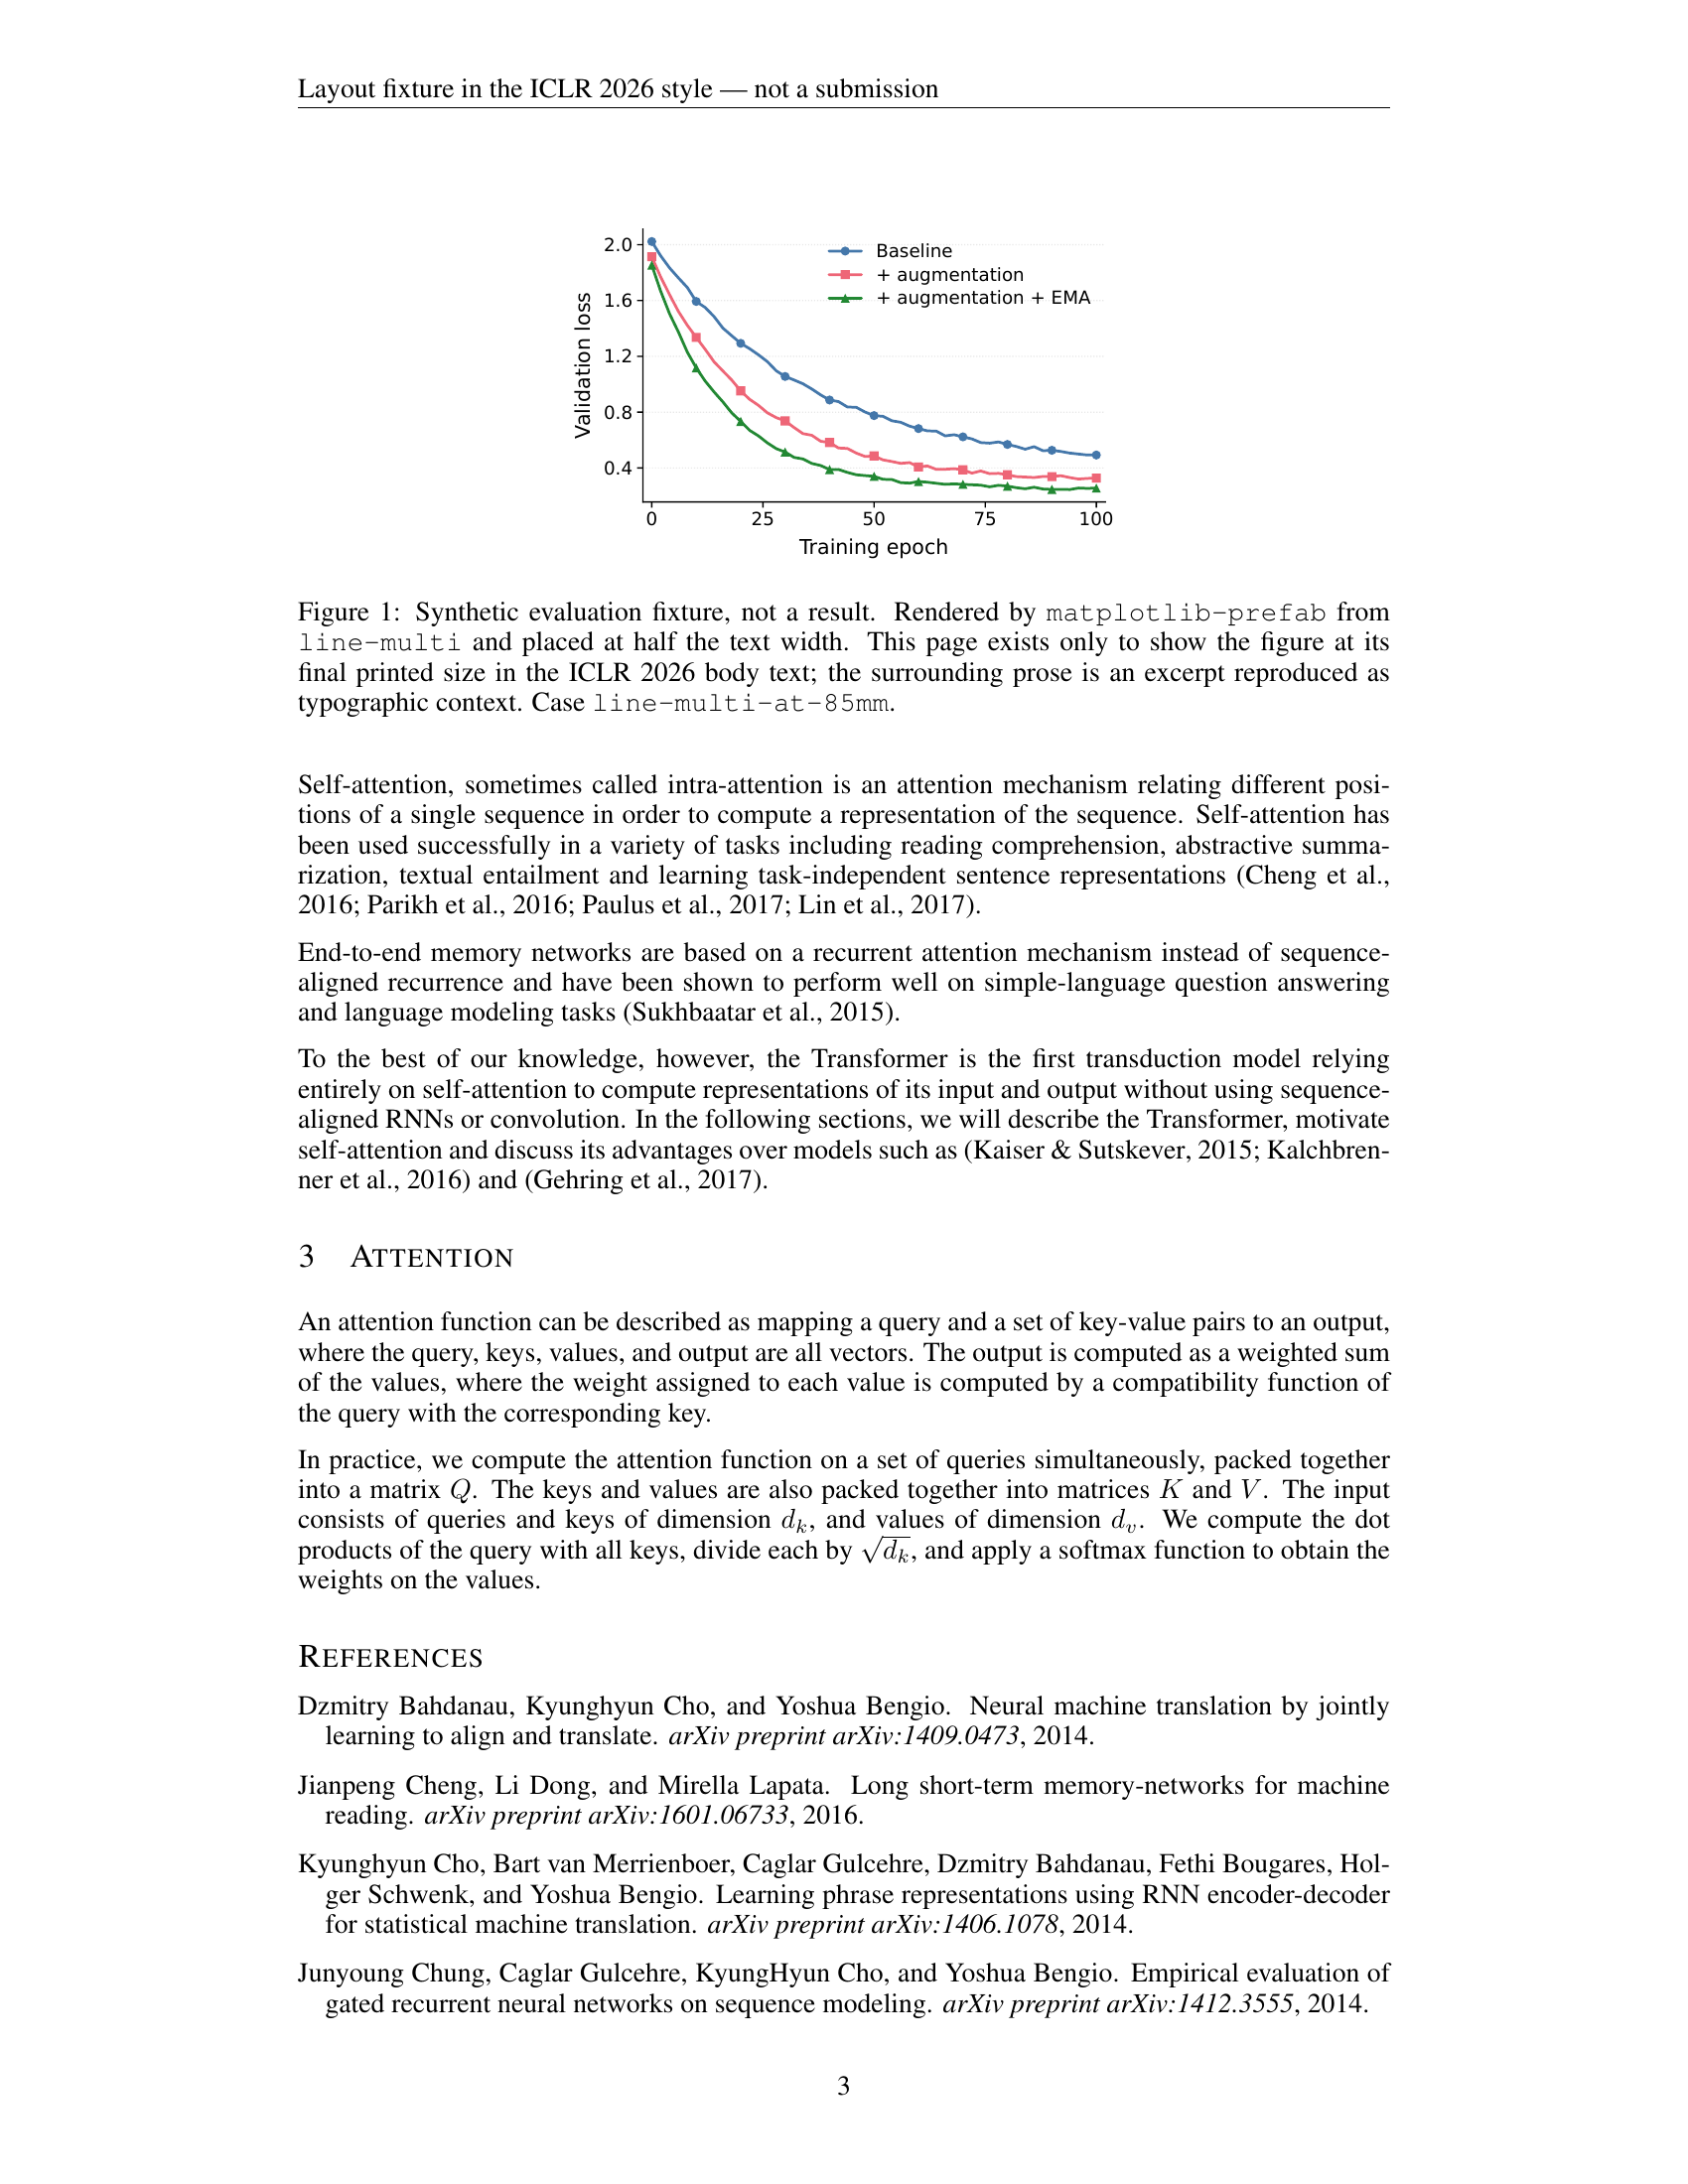
PDF: iclr2026/line-multi-at-85mm/page.pdf · Report: iclr2026/line-multi-at-85mm/context-report.json